

完整的代码:
<!DOCTYPE HTML>
<html>
<head>
<meta http-equiv="Content-Type" content="text/html; charset=utf-8">
<meta name="viewport" content="width=device-width, initial-scale=1">
<meta http-equiv="X-UA-Compatible" content="IE=edge,Chrome=1" />
<title>Highcharts Example</title>
<style type="text/css">
</style>
</head>
<body>
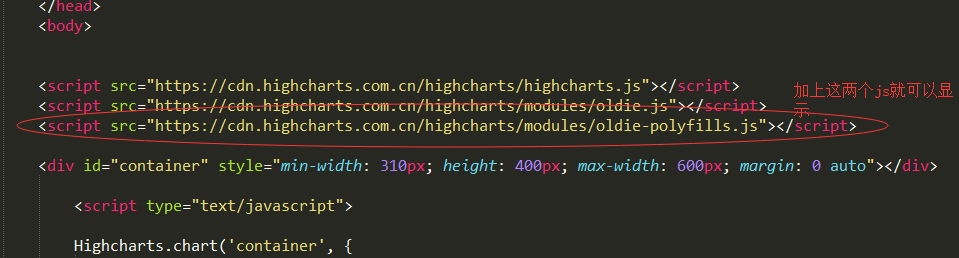
<script src="https://cdn.highcharts.com.cn/highcharts/highcharts.js"></script>
<script src="https://cdn.highcharts.com.cn/highcharts/modules/oldie.js"></script>
<script src="https://cdn.highcharts.com.cn/highcharts/modules/oldie-polyfills.js"></script>
<div id="container" style="min-width: 310px; height: 400px; max-width: 600px; margin: 0 auto"></div>
<script type="text/javascript">
Highcharts.chart('container', {
chart: {
plotBackgroundColor: null,
plotBorderWidth: 0,
plotShadow: false
},
title: {
text: 'Browser<br>shares<br>2017',
align: 'center',
verticalAlign: 'middle',
y: 40
},
tooltip: {
pointFormat: '{series.name}: <b>{point.percentage:.1f}%</b>'
},
plotOptions: {
pie: {
dataLabels: {
enabled: true,
distance: -50,
style: {
fontWeight: 'bold',
color: 'white'
}
},
startAngle: -90,
endAngle: 90,
center: ['50%', '75%'],
size: '110%'
}
},
series: [{
type: 'pie',
name: 'Browser share',
innerSize: '50%',
data: [
['Chrome', 58.9],
['Firefox', 13.29],
['Internet Explorer', 13],
['Edge', 3.78],
['Safari', 3.42],
{
name: 'Other',
y: 7.61,
dataLabels: {
enabled: false
}
}
]
}]
});
</script>
</body>
</html>
