

D3——Axes
使用d3.svg.axis() 创建一个 axis function:
var xAxis = d3.svg.axis();
an axis function is called, it doesn’t return a value, but generates the visual elements of the axis, including lines, labels, and ticks.
xAxis.scale(xScale);
设置label相对axis的位置,默认为bottom, 对horizontal axes(横轴)来说可以设置的值为 top and bottom. For vertical axes(纵轴), use leftand right:
xAxis.orient("bottom");
链式写法:
var xAxis = d3.svg.axis()
                  .scale(xScale)
                  .orient("bottom");
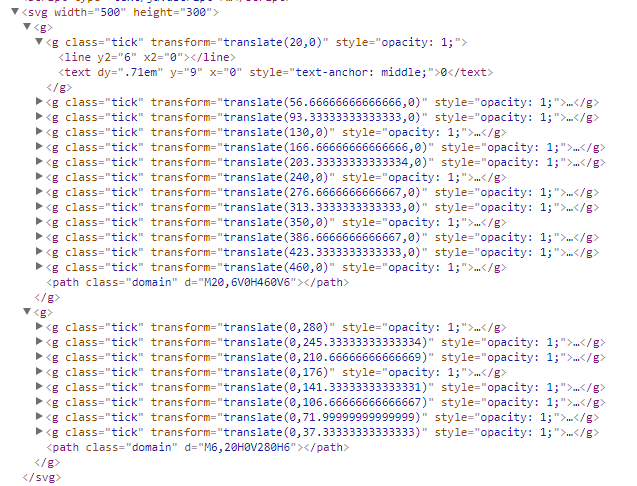
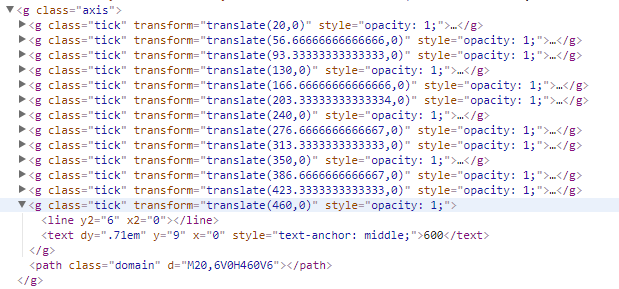
将横轴添加到画布svg上(to actually generate the axis and insert all those little lines and labels into our SVG, we must call the xAxis function)
svg.append("g")
    .call(xAxis);
例子:
 1 <script type="text/javascript">
 2
 3       //Width and height
 4       var w = 500;
 5       var h = 300;
 6       var padding = 20;
 7
 8       var dataset = [
 9            [5, 20], [480, 90], [250, 50], [100, 33], [330, 95],
10                [410, 12], [475, 44], [25, 67], [85, 21], [220, 88],
11                [600, 150]
12     ];
13
14     //Create scale functions
15     var xScale = d3.scale.linear()
16         .domain([0, d3.max(dataset, function(d) {
17                        return  d[0]; })])
18         .range([padding, w - padding * 2]);
19
20     var yScale = d3.scale.linear()
21         .domain([0, d3.max(dataset, function(d) {
22                               return d[1]; })])
23          .range([h - padding, padding]);
24
25     var rScale = d3.scale.linear()
26         .domain([0, d3.max(dataset, function(d) {
27                               return  d[1]; })])
28          .range([2, 5]);
29
30     //Define X axis
31     var xAxis = d3.svg.axis()
32         .scale(xScale)
33         .orient("bottom");
34
35     //Create SVG element
36     var svg = d3.select("body")
37         .append("svg")
38         .attr("width", w)
39         .attr("height", h);
40
41     //Create circles
42     svg.selectAll("circle")
43         .data(dataset)
44         .enter()
45         .append("circle")
46         .attr("cx", function(d) {
47             return xScale(d[0]);
48         })
49         .attr("cy", function(d) {
50             return yScale(d[1]);
51         })
52         .attr("r", function(d) {
53             return rScale(d[1]);
54         });
55
56     //Create labels
57     svg.selectAll("text")
58         .data(dataset)
59         .enter()
60         .append("text")
61         .text(function(d) {
62             return d[0] + "," + d[1];
63         })
64         .attr("x", function(d) {
65                        return xScale(d[0]);
66         })
67         .attr("y", function(d) {
68                        return yScale(d[1]);
69         })
70         .attr("font-family", "sans-serif")
71         .attr("font-size", "11px")
72         .attr("fill", "red");
73
74
75     //Create X axis
76     svg.append("g")
77           .call(xAxis);
78
79 </script>
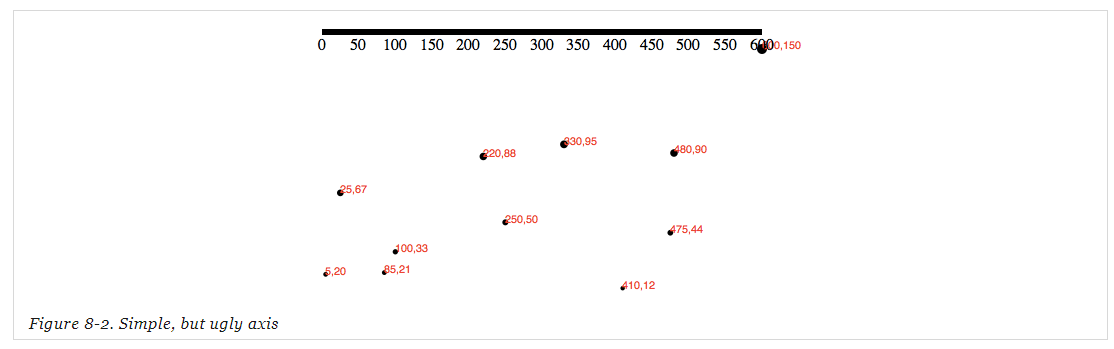
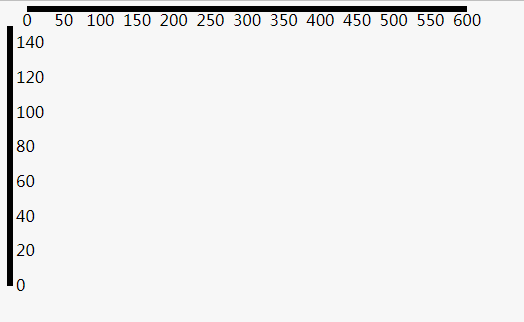
只创建了横纵轴的例子
 1 var w = 500;
 2 var h = 300;
 3 var padding = 20;
 4
 5 var dataset = [
 6         [5, 20], [480, 90], [250, 50], [100, 33], [330, 95],[410, 12], [475, 44], [25, 67], [85, 21], [220, 88],[600, 150]
 7 ];
 8
 9 //create xScale,yScale
10 var xScale = d3.scale.linear()
11           .domain([0, d3.max(dataset, function(d) { return d[0]; })])
12       .range([padding, w - padding * 2]);
13 var yScale = d3.scale.linear()
14           .domain([0, d3.max(dataset, function(d) { return d[1]; })])
15           .range([h - padding, padding]);
16
17 //define X axis , Y axis
18 var xAxis = d3.svg.axis().scale(xScale).orient("bottom");
19 var yAxis = d3.svg.axis().scale(yScale).orient("right");
20
21 //Create SVG element
22 var svg = d3.select("body")
23         .append("svg")
24         .attr("width", w)
25         .attr("height", h);
26
27
28 //Create X axis , Y axis
29
30 svg.append("g").call(xAxis);
31 svg.append("g").call(yAxis);
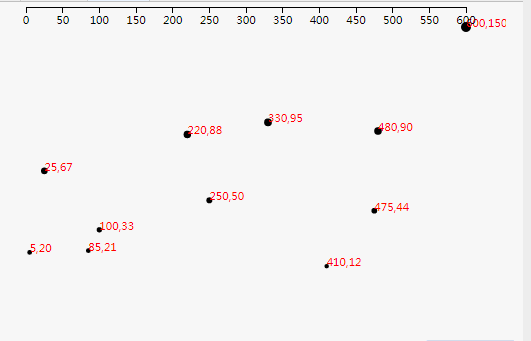
为axes设置样式
svg.append("g")
    .attr("class", "axis") //Assign "axis" class
    .call(xAxis);
// set css style

.axis path,
.axis line {
    fill: none;
    stroke: black;
    shape-rendering: crispEdges;
}

.axis text {
    font-family: sans-serif;
    font-size: 11px;
}
将X axis 向下平移
svg.append("g")
    .attr("class", "axis")
    .attr("transform", "translate(0," + (h - padding) + ")")
    .call(xAxis);
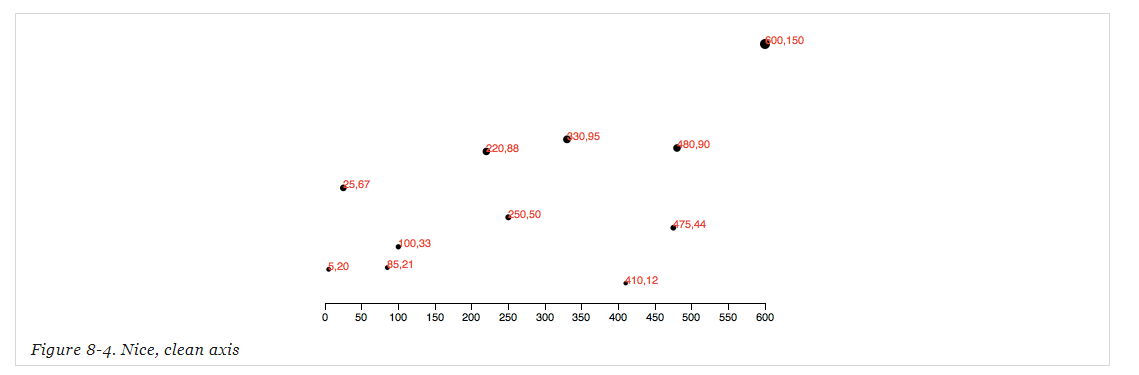
上面的例子中我们并没有指定坐标轴的ticks个数,如果没有特别指定,D3会根据我们的scale (eg: xScale)和其他信息自动为我们设置合适个数的ticks。
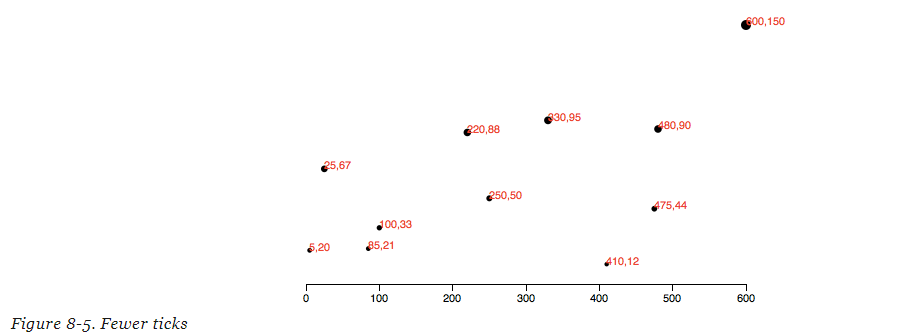
设置ticks个数:
var xAxis = d3.svg.axis()
                  .scale(xScale)
                  .orient("bottom")
                  .ticks(5);  //Set rough # of ticks
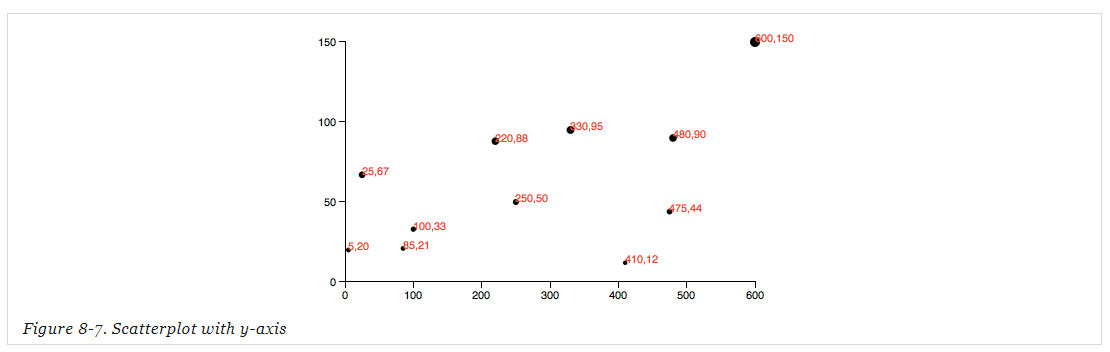
添加上Y axis:
//reset padding= 30;
var padding = 30;

//Define Y axis
var yAxis = d3.svg.axis()
                  .scale(yScale)
                  .orient("left")
                  .ticks(5);


//Create Y axis
svg.append("g")
    .attr("class", "axis")
    .attr("transform", "translate(" + padding + ",0)")
    .call(yAxis);
Formatting Tick Labels
var formatAsPercentage = d3.format(".1%");

xAxis.tickFormat(formatAsPercentage);

formatAsPercentage(.365);     //"36.5%"
formatAsPercentage(1.2);       //"120.0%"
formatAsPercentage(-.5);       //"-50.0%"
