highcharts 图表实例
            var series_values = "";

            var Dates = $("#hid_dates").val().split(',');
            //alert(Dates)
            $.ajax({
                type: "POST",
                url: "/Home/rpt_InfoStatistics",
                data: "",
                success: function (json) {
                    series_values = json;
                    $("#hid_series_values").val(json);
                    var jsons = JSON.parse(series_values);
                    $('#container').highcharts({
                        chart: {
                            type: 'line'
                        },
                        title: {
                            text: ''
                        },
                        subtitle: {
                            text: ''
                        },
                        xAxis: {
                            categories: Dates
                        },
                        yAxis: {
                            title: {
                                text: '在线QQ数量 (个)'
                            }
                        },
                        plotOptions: {
                            line: {
                                dataLabels: {
                                    enabled: true          // 开启数据标签
                                },
                                enableMouseTracking: true // 关闭鼠标跟踪,对应的提示框、点击事件会失效
                            },
                            series: {
                                cursor: 'pointer',
                                point: {
                                    events: {
                                        // 数据点点击事件
                                        // 其中 e 变量为事件对象,this 为当前数据点对象
                                        click: function (e) {
                          //曲线上节点值及名称
                                            //alert(e.point.category + "" + this.series.name)
                                            window.open("/Rpt/InfoStatistics?Name='" + escape(this.series.name) + "'&Date='" + escape(e.point.category) + " '")
                                        }
                                    }
                                },
                                marker: {
                                    lineWidth: 1
                                }
                            }
                        },
                        series: jsons
                    });

                }
            });
 public string rpt_InfoStatistics()
        {
            string json = "[";
            string str_AreaID = string.Empty;
            string sqlwhere = string.Empty;
            string CurrentDates = string.Empty;
            int total = 0;
            DataTable dt = QQMsgbll.Get_CompanyInfo_Table(LoginFilterAttribute.GetUserRightDepts_sqlwhere(), out total);
            foreach (DataRow item in dt.Rows)
            {
                str_AreaID = item["ID"].ToString();
                sqlwhere = " and Area_ID=" + str_AreaID + " ";

                string data = string.Empty;
                string name = string.Empty;
                DataTable StatisticsDT = InfoStatisticsbll.Get_InfoStatistics_Table(LoginFilterAttribute.GetStatistics_sqlwhere() + sqlwhere, out total);
                if (StatisticsDT != null)
                {
                    if (StatisticsDT.Rows.Count > 0)
                    {
                        foreach (DataRow itemL in StatisticsDT.Rows)
                        {
                            name = itemL["Company_Name"].ToString();
                            data += itemL["QQNum"].ToString() + ",";
                            if (!CurrentDates.Contains(itemL["CurrentDate"].ToString()))
                                CurrentDates += itemL["CurrentDate"].ToString() + ",";
                        }
                    }
                }
                if (name != "")
                {
                    json += "{\"name\": \"" + name + "\",\"data\":[" + data.TrimEnd(',') + "]},";
                }
            }
            string str = CurrentDates.Replace("0:00:00", "");
            string[] strs = str.Split(',');
            string s = "";
            for (int i = 0; i < strs.Length - 1; i++)
            {
                if (s == "")
                { s += "'" + strs[i] + "'"; }
                else
                {
                    s += ",'" + strs[i] + "'";
                }
            }
            ViewBag.CurrentDates = s;
            return json.TrimEnd(',') + "]";
        }
<div id="container" style="width:1200px;height:500px"></div>
https://www.hcharts.cn/demo/highcharts 官网地址,有很多实例可下载参考。
引用js文件
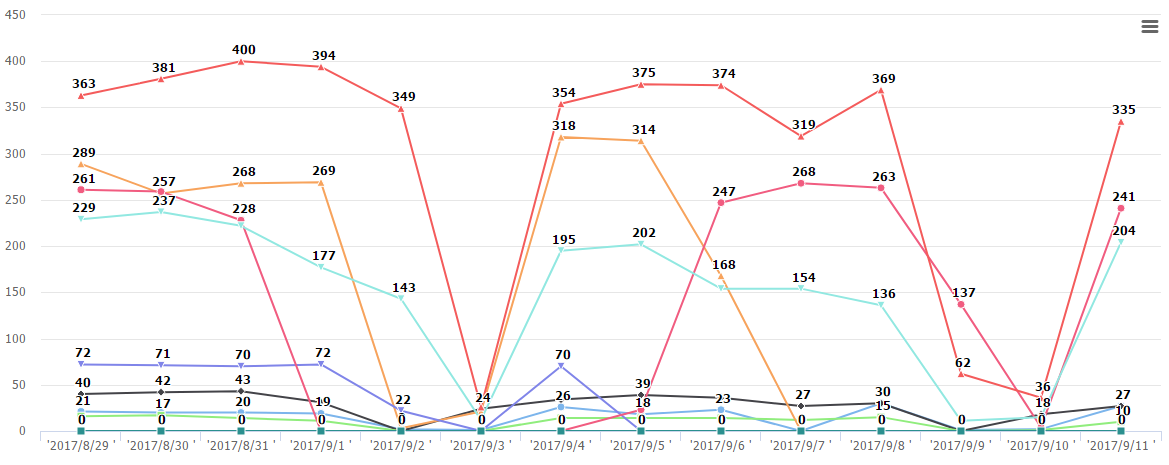
展示效果图:
后台数据格式为:
[
{name: '曲线1', data: [7.0, 6.9, 9.5, 14.5, 18.4, 21.5, 25.2, 26.5, 23.3, 18.3, 13.9, 9.6]},
{name: '曲线2', data: [3.9, 4.2, 5.7, 8.5, 11.9, 15.2, 17.0, 16.6, 14.2, 10.3, 6.6, 4.8]}
]
注:数据格式最外面大括号需要在后台拼接起来传进前台页面内接受 才可以正常显示图表内容。
