


 使用 HT for Web (以下简称 HT)开发HTML5网络拓扑图开发有 Chart 需求的项目的时候,感觉很痛苦,HT 集成的 Chart 组件中,并不包含有坐标,在展现方面不是很直观,但是也不是没有解决方案,接下来我们就来聊聊具体的解决方案。
使用 HT for Web (以下简称 HT)开发HTML5网络拓扑图的开发者有 Chart 需求的项目的时候,感觉很痛苦,HT 集成的 Chart 组件中,并不包含有坐标,在展现方面不是很直观,但是也不是没有解决方案,接下来我们就来聊聊具体的解决方案。
首先,第一种解决方案是,在定义 Chart 矢量的时候在 comps 中除了定义 Chart 外,再添加几个你自定义的绘制区域来绘制你想要的坐标轴,效果及 example 如下:
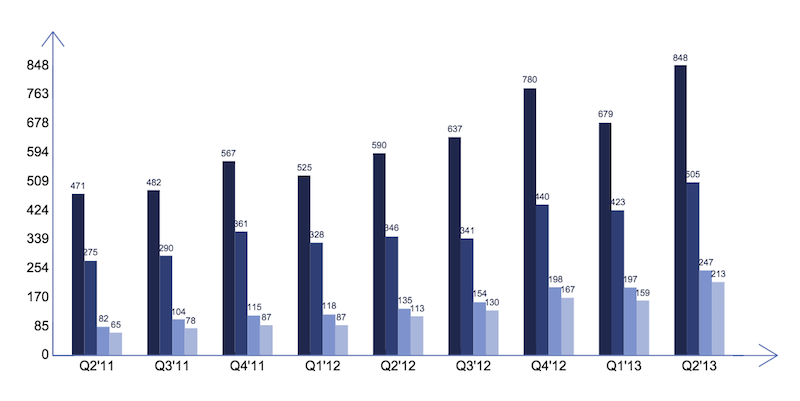
该 Chart 的定义代码见附录1(代码的定义太长),代码虽然长,但是代码的逻辑并不乱,各个模块间的矢量描述还是比较清晰的,具体可以参考 HT 的矢量手册,看到如此长的代码,我自己都没信心去维护它,维护这样的代码纯粹是体力活,而且复用性也不高,每一个不同的 Chart 都要类似如此地绘制,绘制一两个这样的图表感觉还好,绘制多了,真心会感觉很恶心,再这上面很浪费时间。
其次,第二种解决方案是,通过数据绑定来自定义绘制坐标轴。实现以上相同效果,其代码见附录2。可以明显看出其代码量会比第一种解决方案好很多,而且代码可以复用。在其他的图表中,可以将横轴和纵轴的文本内容设置到 data 的 attr 属性上,并在定义 chart 时使用上如下代码就可以实现坐标文本的效果:
1 2 3 4 5 6 7 8 9 10 11 12 13 14 15 16 17 | ht.Default.setImage('chartName', { width: Number, height: Number, comps: [ { // define chart }, { type: 'xAxis', rect: Array }, { type: 'yAxis', rect: Array } ]}); |
在这里我已经通过 ht.Default.setCompType('typeName', function(g, rect, comp, data, view){}) 的方法定义了名字为 xAxis 和 yAxis 的 CompType,这两个 CompType 分别绘制了横轴和纵轴的坐标文本,代替了第一种方案制定多个 CompType 为 text 的写法,稍微优化了下代码,提高代码的可维护性。
但是,这样但使用方法总刚觉有些别扭,明明坐标轴是 Chart 的一部分,在定义 Chart 上却要硬生生地将图表和坐标部分分开,那如果用户还要在定义标题、坐标刻度、坐标说明等需求,那这个方案还是无法爽快的解决大部分通用的需求,需要定义许多 CompType 来渲染不同的需求,而且在使用上也不是那么爽快。接下来要说明的方案三,就是来解决使用上及维护上的问题。
最后,第三种解决方案是,和第二种解决方案差不多,都是通过 ht.Default.setCompType('typeName', function(g, rect, comp, data, view){}) 的方法来定义名字为 axisChart 的 CompType,不同的是,数据并不是设置到 data 中,而是在 ht.Default.setImage() 的 comps 中直接定义其相关属性。具体的配置属性说明及其具体的代码实现可以查看附件,使用方式很简单,在引入 ht.js 核心文件的前提下,引入附件1的 axisChart.js 文件即可。
接下来来看下 axisChart 的具体使用及几个简单的例子:
例1:设计同一时刻不同小区之间的电流电压情况的柱状图柱状图:

代码如下:
1 2 3 4 5 6 7 8 9 10 11 12 13 14 15 16 17 18 19 20 21 22 23 24 25 26 27 28 29 30 31 32 33 34 35 36 37 38 39 40 41 42 43 44 45 46 47 48 49 50 51 52 53 54 55 56 57 58 59 60 61 62 63 64 65 66 67 68 69 | ht.Default.setImage('c1', { width: 600, height: 400, comps: [ { type: 'axisChart', rect: [0, 0, 600, 400], yAxis: [ { name: '单位:V', max: 270, min: 150, splitNumber: 10, axisTitle: { text: '电压', rotate: -90 }, axisLine: { arrow: true } }, { position: 'right', name: '单位:I', max: 20, splitNumber: 20, axisTitle: { text: '电流', rotate: 90 }, axisLabel: { interval: 1 }, axisLine: { arrow: true } } ], xAxis: [ { type: 'category', data: ['抚梅源', '藕花深处', '紫东花园', '紫金苑', '华府山水', '水云间', '瑞景新城'], axisTitle: { text: '小区名称' } } ], series: [ { label: function(value){ return value + ' V'; }, data: { values: [220, 210, 200, 209, 230, 215, 218], color: '#f90' } }, { yAxisPosition: 'right', label: true, data: { values: [10, 4, 15, 9, 12, 18, 7], color: '#af0' } } ] } ]}); |
例2: 不同时刻,不同小区的电压情况的折线图:

代码如下:
1 2 3 4 5 6 7 8 9 10 11 12 13 14 15 16 17 18 19 20 21 22 23 24 25 26 27 28 29 30 31 32 33 34 35 36 37 38 39 40 41 42 43 44 45 46 47 48 49 50 51 52 53 54 55 56 57 58 59 60 61 62 63 64 65 66 67 68 69 70 | ht.Default.setImage('c2', { width: 600, height: 400, comps: [ { type: 'axisChart', rect: [0, 0, 600, 400], yAxis: [ { name: '单位:V', max: 240, min: 190, splitNumber: 10, axisTitle: { text: '电压', rotate: -90 }, axisLine: { arrow: true } } ], xAxis: [ { type: 'time', min: new Date(2015, 0, 1), max: new Date(2015, 0, 2), splitNumber: 25, axisTitle: { text: '时间' }, axisLabel: { interval: 2, formatter: function(value, index, min, max){ return value.format('dd-hh'); } }, axisLine: { arrow: true } } ], series: [ { type: 'line', data: { values: [220, 210, 200, 209, 230, 215, 218, 220, 210, 200, 209, 230, 215, 218, 209, 230, 215, 218, 220, 210, 200, 209, 230, 215, 218], color: '#f90' } }, { type: 'line', data: { values: [225, 209, 208, 206, 205, 221, 213, 224, 218, 224, 205, 208, 216, 220, 208, 210, 219, 219, 210, 209, 219, 207, 222, 222, 215], color: '#7d0' } }, { type: 'line', linePoint: true, line3d: true, data: { values: [211, 216, 215, 205, 206, 206, 223, 217, 217, 215, 212, 221, 219, 222, 205, 208, 205, 218, 223, 222, 207, 215, 215, 222, 223], color: '#ab0' } } ] } ]}); |
最后,还有一点要说明,axisChart 的代码并不是那么的无懈可击,我个人觉得代码设计上还是有些欠缺,所有的代码总共有差不多 1000 行,我觉得太臃肿了,在设计上自己也感觉不是那么的友好,等想修改的时候发现已经投入太多时间了,还有好多事情等待着我我去学习、去探讨,所以也就线这样吧,等有空了再重构一番,但是我相信在功能上还是能够满足大部分的需求,在设计上,或者是实现的方法上,还是在使用过程中发现的 bug,还望大家能够不吝赐教。
附录1
1 2 3 4 5 6 7 8 9 10 11 12 13 14 15 16 17 18 19 20 21 22 23 24 25 26 27 28 29 30 31 32 33 34 35 36 37 38 39 40 41 42 43 44 45 46 47 48 49 50 51 52 53 54 55 56 57 58 59 60 61 62 63 64 65 66 67 68 69 70 71 72 73 74 75 76 77 78 79 80 81 82 83 84 85 86 87 88 89 90 91 92 93 94 95 96 97 98 99 100 101 102 103 104 105 106 107 108 109 110 111 112 113 114 115 116 117 118 119 120 121 122 123 124 125 126 127 128 129 130 131 132 133 134 135 136 137 138 139 140 141 142 143 144 145 146 147 148 149 150 151 152 153 154 155 156 157 158 159 160 161 162 163 164 165 166 167 168 169 170 171 172 173 174 175 176 177 178 179 180 181 182 | ht.Default.setImage('chart', { width: 650, height: 380, comps: [ // column chart { type: 'columnChart', rect: [10, 60, 630, 260], label: true, labelColor: '#20284C', labelFont: '8px Arial', series: [ { color: '#20284C', values: [471, 482, 567, 525, 590, 637, 780, 679, 848] }, { color: '#303F74', values: [275, 290, 361, 328, 346, 341, 440, 423, 505] }, { color: '#7E93CD', values: [82, 104, 115, 118, 135, 154, 198, 197, 247] }, { color: '#A9B6DB', values: [65, 78, 87, 87, 113, 130, 167, 159, 213] } ] }, // 竖线 { type: 'rect', rect: [15, 60, 1, 260], background: '#566CB0' }, { type: 'shape', rect: [5.5, 30, 20, 30], borderWidth: 1, borderColor: '#566CB0', points: [0, 20 / 3 * 2, 20 / 2, 0, 20, 20 / 3 * 2, 20 / 2, 0, 20 / 2, 30], segments: [1, 2, 2, 1, 2] }, // 坐标文本 { type: 'text', rect: [0, 320 - 26 * 10 - 8, 15, 16], align: 'right', text: Math.round(84.8 * 10) }, { type: 'text', rect: [0, 320 - 26 * 9 - 8, 15, 16], align: 'right', text: Math.round(84.8 * 9) }, { type: 'text', rect: [0, 320 - 26 * 8 - 8, 15, 16], align: 'right', text: Math.round(84.8 * 8) }, { type: 'text', rect: [0, 320 - 26 * 7 - 8, 15, 16], align: 'right', text: Math.round(84.8 * 7) }, { type: 'text', rect: [0, 320 - 26 * 6 - 8, 15, 16], align: 'right', text: Math.round(84.8 * 6) }, { type: 'text', rect: [0, 320 - 26 * 5 - 8, 15, 16], align: 'right', text: Math.round(84.8 * 5) }, { type: 'text', rect: [0, 320 - 26 * 4 - 8, 15, 16], align: 'right', text: Math.round(84.8 * 4) }, { type: 'text', rect: [0, 320 - 26 * 3 - 8, 15, 16], align: 'right', text: Math.round(84.8 * 3) }, { type: 'text', rect: [0, 320 - 26 * 2 - 8, 15, 16], align: 'right', text: Math.round(84.8 * 2) }, { type: 'text', rect: [0, 320 - 26 * 1 - 8, 15, 16], align: 'right', text: Math.round(84.8 * 1) }, { type: 'text', rect: [0, 320 - 8, 15, 16], align: 'right', text: 0 }, // Q { type: 'text', rect: [55, 322, 0, 16], align: 'center', text: 'Q2\'11' }, { type: 'text', rect: [124, 322, 0, 16], align: 'center', text: 'Q3\'11' }, { type: 'text', rect: [191, 322, 0, 16], align: 'center', text: 'Q4\'11' }, { type: 'text', rect: [259, 322, 0, 16], align: 'center', text: 'Q1\'12' }, { type: 'text', rect: [327, 322, 0, 16], align: 'center', text: 'Q2\'12' }, { type: 'text', rect: [394, 322, 0, 16], align: 'center', text: 'Q3\'12' }, { type: 'text', rect: [462, 322, 0, 16], align: 'center', text: 'Q4\'12' }, { type: 'text', rect: [529, 322, 0, 16], align: 'center', text: 'Q1\'13' }, { type: 'text', rect: [596, 322, 0, 16], align: 'center', text: 'Q2\'13' }, // line { type: 'rect', rect: [15, 320, 620, 1], background: '#566CB0' }, { type: 'shape', rect: [635, 310.5, 30, 20], borderWidth: 1, borderColor: '#566CB0', points: [20 / 3 * 2, 0, 30, 20 / 2, 20 / 3 * 2, 20, 30, 20 / 2, 0, 20 / 2], segments: [1, 2, 2, 1, 2] } ]}); |
附录2
1 2 3 4 5 6 7 8 9 10 11 12 13 14 15 16 17 18 19 20 21 22 23 24 25 26 27 28 29 30 31 32 33 34 35 36 37 38 39 40 41 42 43 44 45 46 47 48 49 50 51 52 53 54 55 56 57 58 59 60 61 62 63 64 65 66 67 68 69 70 71 72 73 74 75 76 77 78 79 80 81 82 83 84 85 86 87 88 89 90 91 92 93 94 95 96 97 98 99 100 101 102 103 104 105 106 107 108 109 110 111 112 | ht.Default.setCompType('yAxis', function(g, rect, comp, data, view) { var labels = data.a('yLabels'), len = labels.length, x = rect.x, y = rect.y, w = rect.width, h = rect.height, dh = h / (len - 1); g.save(); g.font = '12px arial, sans-serif'; g.fillStyle = 'black'; g.textAlign = 'right'; for(var i = 0; i < len; i++){ g.fillText(labels[i], x, y); y += dh; } g.restore();});ht.Default.setCompType('xAxis', function(g, rect, comp, data, view) { var labels = data.a('xLabels'), len = labels.length, x = rect.x, y = rect.y, w = rect.width, h = rect.height, dw = w / (len * 3 + 1), dw3 = 3 * dw; x += dw * 2; g.save(); g.font = '12px arial, sans-serif'; g.fillStyle = 'black'; g.textAlign = 'center'; for(var i = 0; i < len; i++){ g.fillText(labels[i], x, y); x += dw3; } g.restore();});ht.Default.setImage('chart1', { width: 650, height: 380, comps: [ // column chart { type: 'columnChart', rect: [10, 60, 630, 260], label: true, labelColor: '#20284C', labelFont: '8px Arial', series: [ { color: '#20284C', values: [471, 482, 567, 525, 590, 637, 780, 679, 848] }, { color: '#303F74', values: [275, 290, 361, 328, 346, 341, 440, 423, 505] }, { color: '#7E93CD', values: [82, 104, 115, 118, 135, 154, 198, 197, 247] }, { color: '#A9B6DB', values: [65, 78, 87, 87, 113, 130, 167, 159, 213] } ] }, // 竖线 { type: 'rect', rect: [15, 60, 1, 260], background: '#566CB0' }, // 向上的箭头 { type: 'shape', rect: [5.5, 30, 20, 30], borderWidth: 1, borderColor: '#566CB0', points: [0, 20 / 3 * 2, 20 / 2, 0, 20, 20 / 3 * 2, 20 / 2, 0, 20 / 2, 30], segments: [1, 2, 2, 1, 2] }, // 坐标文本 { type: 'yAxis', rect: [12, 60, 15, 260] }, // Q { type: 'xAxis', rect: [10, 330, 630, 16] }, // line { type: 'rect', rect: [15, 320, 620, 1], background: '#566CB0' }, // 向右的箭头 { type: 'shape', rect: [635, 310.5, 30, 20], borderWidth: 1, borderColor: '#566CB0', points: [20 / 3 * 2, 0, 30, 20 / 2, 20 / 3 * 2, 20, 30, 20 / 2, 0, 20 / 2], segments: [1, 2, 2, 1, 2] } ]}); |

【推荐】编程新体验,更懂你的AI,立即体验豆包MarsCode编程助手
【推荐】凌霞软件回馈社区,博客园 & 1Panel & Halo 联合会员上线
【推荐】抖音旗下AI助手豆包,你的智能百科全书,全免费不限次数
【推荐】博客园社区专享云产品让利特惠,阿里云新客6.5折上折
【推荐】轻量又高性能的 SSH 工具 IShell:AI 加持,快人一步