基于Extjs可视工作流设计器的实现
一、说明
可视化工作流设计管理器是工作流系统的一部分。实现工作流活动,转移的可视化配置。通常工作流系统会涉及以下几方面的内容。
1. 工作流定义
2. 组织机构实现
3. 工作流授权实现
4. 动态表单实现
5. 工作流引擎实现
6. 工作流可视化定义维护
本文只说明工作流设计器的实现。设计器有很多实现的方法,本文只说明用Extjs实现需要处理的问题。
二、工作流设计器的功能
主体功能
1. 增加、删除活动
2. 增加、删除转移
3. 修改活动、转移属性
设计器界面效果
1. 活动节点定位
2. 橡皮筋拖动,重叠检测与反弹
3. 自动、手动选择线型
4. 线型的偏移和圆色修饰
5. 网格定位(snap)
6. 流程执行路径展示。
三、基本功能实现
设计器要解决的首要问题是节点定位,拖动,画线。
节点定位:活动结点,以Div来表示,其内部为图标区和文字说明区。节点定位通过样式postion来实现
节点拖动:通过Extjs 的DragDrop相关类来实现。
画线:使用canvas标记。IE中,通过Google提供的库来实现。
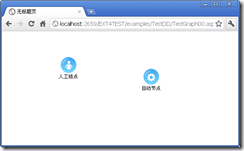
1.最简单的场景:页面中两个可以移动的节点。

相关的代码只有两句:
Ext.onReady(function(){
node1 = new Ext.dd.DD( 'IconManual','g2');
node2 = new Ext.dd.DD( 'IconAuto','g2' );
});
2.拖动画线
对上面的例子做一个扩充。定义一个节点类,封装相关的功能。
定义一个画布,用于画线。
下面是源代码:
TestGraph00.apsx
<%@ Page Language="C#" AutoEventWireup="true" CodeFile="TestGraph01.aspx.cs" Inherits="Common_Workflow_TestGraph01" %>
<!DOCTYPE html PUBLIC "-//W3C//DTD XHTML 1.0 Transitional//EN" "http://www.w3.org/TR/xhtml1/DTD/xhtml1-transitional.dtd">
<html xmlns="http://www.w3.org/1999/xhtml">
<head runat="server">
<title>无标题页</title>
<!-- ExtJS -->
<link rel="stylesheet" type="text/css" href="http://www.cnblogs.com/resources/css/ext-all.css" />
<script type="text/javascript" src="http://www.cnblogs.com/bootstrap.js"></script>
<script type="text/javascript" src="Script/excanvas.js"></script>
<link href="Css/TestGraph01.css" rel="stylesheet" type="text/css" />
<script type="text/javascript" src="Script/excanvas.js"></script>
<script src="Script/Graph01.js" type="text/javascript"></script>
</head>
<body>
<form id="form1" runat="server">
<div id="canvas" class="canvas">
<canvas id="mainGraph" width="800" height="500" class="mainGraph"></canvas>
<canvas id="markGraph" width="800" height="500" class="markGraph"></canvas>
<div align="center" class="iconZone" id="IconManual">
<div class="iconActManual">
</div>
<div id='NodeNameDiv'>
人工结点</div>
</div>
<div align="center" class="iconZone" id="IconAuto">
<div class="iconActAuto">
</div>
<div id="NodeNameDiv">
自动节点</div>
</div>
</div>
</form>
</body>
</html>
注意:markGraph暂时没有使用。
js代码:
var node1,node2;
Ext.onReady(function(){
var elMainGraph = Ext.get('mainGraph');
var mainGraph = Ext.get('mainGraph').dom.getContext('2d');
node1 = new ActivityNode( 'IconManual','g2',null,elMainGraph );
node2 = new ActivityNode( 'IconAuto','g2',null,elMainGraph );
});
//流程中节点类,扩展自 Ext.dd.DD
ActivityNode = function(el, sGroup, config,elMainGraph)
{
//构造DD
this.init(el, sGroup, config);
this.mainGraph = Ext.get('mainGraph').dom.getContext('2d');
this.elMainGraph = elMainGraph;
this.NodeEl = Ext.get(this.getEl());
//定义约束
this.constrainX=true;
this.constrainY = true;
this.minX = this.elMainGraph.getLeft();
this.maxX = this.elMainGraph.getRight() - this.NodeEl.getWidth();
this.minY = this.elMainGraph.getTop();
this.maxY = this.elMainGraph.getBottom() - this.NodeEl.getHeight();
};
Ext.extend(ActivityNode,Ext.dd.DD,{
//重新计算约束,约束到 主绘图区,resize后为当前窗口区
reCalculateNode:function(){
this.constrainX=true;
this.constrainY = true;
this.minX = this.elMainGraph.getLeft();
this.maxX= this.elMainGraph.getRight() - this.NodeEl.getWidth();
this.minY = this.elMainGraph.getTop();
this.maxY= this.elMainGraph.getBottom() - this.NodeEl.getHeight();
this.dimX = this.getNodeXY().x - this.elMainGraph.getLeft(); //相对于绘图区的坐标X
this.dimY = this.getNodeXY().y - this.elMainGraph.getTop(); //相对于绘图区的坐标Y
}
//取中心坐标值,相对坐标。
,getCenterXY:function(){
return {x:this.dimX,y:this.dimY};
}
//取节点的中心 屏幕坐标, 返回ICON 中心
,getNodeXY:function (){
var x = this.NodeEl.getLeft() + this.NodeEl.getWidth() /2 ;
var y = this.NodeEl.getTop() + (this.NodeEl.getHeight() - 12)/2 ; //需减去文本的高度
return {x:x,y:y};
}
//拖动时
,onDrag:function (e){
//从另一个节点画到当前节点
var start = this.NodeEl.id == 'IconManual' ? node2: node1;
var startXY = start.getCenterXY();
var endXY = this.getCenterXY();
this.reCalculateNode();
this.mainGraph.beginPath();
this.mainGraph.strokeStyle = '#0000FF';
this.mainGraph.clearRect(0, 0, this.elMainGraph.getWidth(),this.elMainGraph.getHeight());
this.mainGraph.moveTo(startXY.x,startXY.y);
this.mainGraph.lineTo(endXY.x,endXY.y);
this.mainGraph.stroke();
}
});
因为本例子只是为了说明如何定位和画线,所以程序写得比较随意,有一些问题没有处理。
============================================================================================================
另注:可能没有写清楚,点击图片是可以在线演示的。


