Echart在饼图中央添加文字
如果想要添加动态文字包括需要计算出数值的,可以参考以下链接:http://gallery.echartsjs.com/editor.html?c=xByzFvaw1M
为预防数据失效,贴出代码如下:
var scale = 1;
var echartData = [{
    value: 2154,
    name: '曲阜师范大学'
}, {
    value: 3854,
    name: '潍坊学院'
}, {
    value: 3515,
    name: '青岛职业技术学院'
}, {
    value: 3515,
    name: '淄博师范高等专科'
}, {
    value: 3854,
    name: '鲁东大学'
}, {
    value: 2154,
    name: '山东师范大学'
}]
var rich = {
    yellow: {
        color: "#ffc72b",
        fontSize: 30 * scale,
        padding: [5, 4],
        align: 'center'
    },
    total: {
        color: "#ffc72b",
        fontSize: 40 * scale,
        align: 'center'
    },
    white: {
        color: "#fff",
        align: 'center',
        fontSize: 14 * scale,
        padding: [21, 0]
    },
    blue: {
        color: '#49dff0',
        fontSize: 16 * scale,
        align: 'center'
    },
    hr: {
        borderColor: '#0b5263',
        width: '100%',
        borderWidth: 1,
        height: 0,
    }
}
option = {
    backgroundColor: '#031f2d',
    title: {
        text:'总考生数',
        left:'center',
        top:'53%',
        padding:[24,0],
        textStyle:{
            color:'#fff',
            fontSize:18*scale,
            align:'center'
        }
    },
    legend: {
        selectedMode:false,
        formatter: function(name) {
            var total = 0; //各科正确率总和
            var averagePercent; //综合正确率
            echartData.forEach(function(value, index, array) {
                total += value.value;
            });
            return '{total|' + total + '}';
        },
        data: [echartData[0].name],
        // data: ['高等教育学'],
        // itemGap: 50,
        left: 'center',
        top: 'center',
        icon: 'none',
        align:'center',
        textStyle: {
            color: "#fff",
            fontSize: 16 * scale,
            rich: rich
        },
    },
    series: [{
        name: '总考生数量',
        type: 'pie',
        radius: ['42%', '50%'],
        hoverAnimation: false,
        color: ['#c487ee', '#deb140', '#49dff0', '#034079', '#6f81da', '#00ffb4'],
        label: {
            normal: {
                formatter: function(params, ticket, callback) {
                    var total = 0; //考生总数量
                    var percent = 0; //考生占比
                    echartData.forEach(function(value, index, array) {
                        total += value.value;
                    });
                    percent = ((params.value / total) * 100).toFixed(1);
                    return '{white|' + params.name + '}\n{hr|}\n{yellow|' + params.value + '}\n{blue|' + percent + '%}';
                },
                rich: rich
            },
        },
        labelLine: {
            normal: {
                length: 55 * scale,
                length2: 0,
                lineStyle: {
                    color: '#0b5263'
                }
            }
        },
        data: echartData
    }]
};
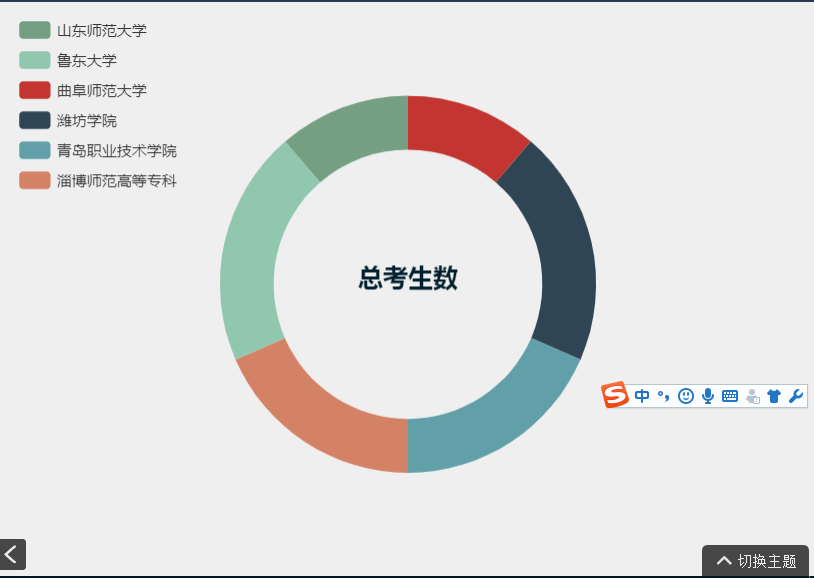
如果想要制作简单的显示数据的例子可参考如下代码,最简单的方式就是通过title控制:
var scale = 1;
    var echartData = [{
      value: 2154,
      name: '曲阜师范大学'
    }, {
      value: 3854,
      name: '潍坊学院'
    }, {
      value: 3515,
      name: '青岛职业技术学院'
    }, {
      value: 3515,
      name: '淄博师范高等专科'
    }, {
      value: 3854,
      name: '鲁东大学'
    }, {
      value: 2154,
      name: '山东师范大学'
    }]

    option = {
      legend: {
        orient : 'vertical',
        x : 'left',
        data:['山东师范大学','鲁东大学','曲阜师范大学'/*,'潍坊学院','青岛职业技术学院','淄博师范高等专科'*/]
      },
      //backgroundColor: '#031f2d',
      tooltip : {
        trigger: 'item',
        formatter: "{a} <br/>{b} : {c} ({d}%)"
      },
      title: {
        text:'总考生数',
        left:'center',
        top:'45%',
        // padding:[24,0],
        textStyle:{
          color:'#031f2d',
          fontSize:20*scale,
          align:'center'
        }
      },

      series: [{
        name: '考生数量',
        type: 'pie',
        //radius: ['45%', '50%'],
        radius : ['50%', '70%'],
        hoverAnimation: true,
        //color: ['#c487ee', '#deb140', '#49dff0', '#034079', '#6f81da', '#00ffb4'],
       /* labelLine: {
          normal: {
            show: false
          }
        },*/
        itemStyle : {
          normal : {
            label : {
              show : false
            },
            labelLine : {
              show : false
            }
          },

        },
        data: echartData
      }]
    };
运行结果如下: