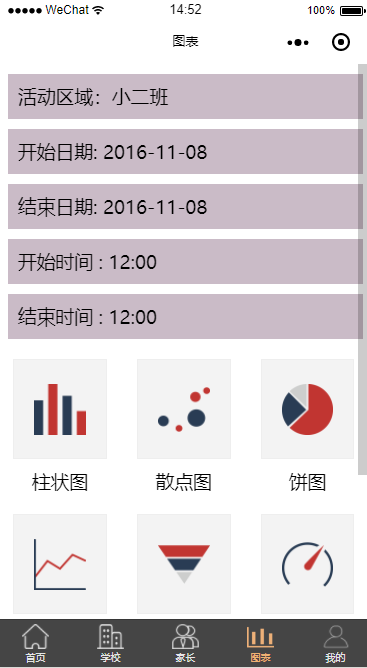
<view class="container">
        <swiper-item class="tab-content">
              <view class="section" >
                <picker bindchange="bindPickerChange" value="{{index}}" range="{{objectArray}}" range-key="{{'text'}}" mode = "selector">
                  <view class="picker">
                    活动区域:{{objectArray[index].text}}
                  </view>
                </picker>
              </view>
              <view class="section">
                <picker mode="date" value="{{date}}" start="1978-01-01" end="2999-1-23" bindchange="bindStartDate">
                  <view class="picker">
                    开始日期: {{dates}}
                  </view>
                </picker>
              </view>
              <view class="section" >
                <picker bindchange="bindOverDate" mode="date" value="{{date}}" start="1978-01-01" end="2999-1-23">
                  <view class="picker">
                    结束日期: {{dateDay}}
                  </view>
                </picker>
              </view>
              <view class="section">
                <picker mode="time" value="{{time}}" start="00:00" end="23:59" bindchange="bindStartTime">
                  <view class="picker">
                  开始时间 : {{times}}
                  </view>
                </picker>
              </view>
              <view class="section">
                <picker mode="time" value="{{time}}" start="00:00" end="23:59" bindchange="bindOverTime">
                  <view class="picker">
                  结束时间 : {{timeDay}}
                  </view>
                </picker>
              </view>
              <view class="chart-with-img" wx:for="{{charts}}" wx:for-item="chart" wx:key="{{chart.id}}">
                <image src="../../images/icons/{{chart.id}}.png" mode="aspectFit" bindtap="open" data-chart="{{chart}}"></image>
                {{chart.name}}
              </view>
        </swiper-item>
</view>
const app = getApp()
Page({
  data: {
    userInfo: {},
    hasUserInfo: false,
    canIUse: wx.canIUse('button.open-type.getUserInfo'),

    charts: [{
      id: 'bar',
      name: '柱状图'
    }, {
      id: 'scatter',
      name: '散点图'
    }, {
      id: 'pie',
      name: '饼图'
    }, {
      id: 'line',
      name: '折线图'
    }, {
      id: 'funnel',
      name: '漏斗图'
    }, {
      id: 'gauge',
      name: '仪表图'
    }, {
      id: 'k',
      name: '天'
    }, {
      id: 'radar',
      name: '周'
    }, {
      id: 'heatmap',
      name: '月'
    }],

    currentTab: 0,
    navScrollLeft: 0,

    dates: '2016-11-08',
    dateDay:'2016-11-08',
    times: '12:00',
    timeDay: '12:00',
    objectArray: [
      {
        text: '小二班',
        txt: 'Small_Class_Two_Classroom'
      },
      {
        text: '小四班',
        txt: 'Small_Class_Four_Classroom'
      },
      {
        text: '操场',
        txt: 'Playground'
      }
    ],
    index: 0,
  },

  open: function (e) {
    wx.navigateTo({
      url: '../' + e.target.dataset.chart.id + '/index'
    });
  },

  //  点击城市组件确定事件
  bindPickerChange: function (e) {
    this.setData({
      index: e.detail.value
    })
    var index = e.detail.value
    var objectArray = this.data.objectArray;
    wx.setStorageSync('place', objectArray[index].txt)
  },
  //  点击开始时间组件确定事件
  bindStartTime: function (e) {
    this.setData({
      times: e.detail.value
    })
    var times = e.detail.value;
    wx.setStorageSync('startTime', times)
  },
  //  点击结束时间组件确定事件
  bindOverTime: function (e) {
    this.setData({
      timeDay: e.detail.value
    })
    var timeDay = e.detail.value;
    wx.setStorageSync('overTime', timeDay)
  },
  //  点击开始日期组件确定事件
  bindStartDate: function (e) {
    this.setData({
      dates: e.detail.value
    })
    var dates = e.detail.value;
    wx.setStorageSync('startDate', dates)
  },
  //  点击结束日期组件确定事件
  bindOverDate: function (e) {
    this.setData({
      dateDay: e.detail.value
    })
    var dateDay = e.detail.value;
    wx.setStorageSync('overDate', dateDay)
  }

})
page{
    width: 100%;
    height: 100%;
}
.container{
    width: 100%;
    height: 100%;
}

.tab-content{
    overflow-y: scroll;
}

/*图标  */
.chart-with-img {
  display: inline-block;
  width: 25%;
  margin: 10px 4%;
  text-align: center;
}

.chart-with-img image {
  box-sizing: border-box;
  width: 100%;
  height: 100px;
  padding: 20px;
  background-color: #f3f3f3;
  border: 1px solid #eee;
  display: block;
  margin: 0 auto;
  margin-bottom: 10px;
}


/*日期 */

.section{
   background:#CABBC7;
   margin:20rpx;
   padding:20rpx
}

<view class="container">
  <ec-canvas id="mychart-dom-bar" canvas-id="mychart-bar" ec="{{ ec }}"></ec-canvas>
</view>
import * as echarts from '../../ec-canvas/echarts';
var barec = null
Page({
  onShareAppMessage: function (res) {
    return {
      title: 'ECharts 可以在微信小程序中使用啦!',
      path: '/pages/index/index',
      success: function () { },
      fail: function () { }
    }
  },
  data: {
    ec: {
      onInit: function (canvas, width, height) {
        barec = echarts.init(canvas, null, {
          width: width,
          height: height
        });
        canvas.setChart(barec);
        return barec;
      }
    }
  },

  onReady() {
    setTimeout(this.getData, 500);
  },
  //getData方法里发送ajax
  getData() {
    wx.showLoading({
      title: '加载中...',
    })
    var startTime = wx.getStorageSync('startTime');
    var overTime = wx.getStorageSync('overTime');
    var startDate = wx.getStorageSync('startDate');
    var overDate = wx.getStorageSync('overDate');
    var place = wx.getStorageSync('place');
    wx.request({
      url: 'url',
      data: {
        startTime: startDate + " "+ startTime + ":00",
        overTime: overDate +" "+ overTime +":00",
        place: place || "Small_Class_Two_Classroom",
      },
      herder: {
        "content-type": "json"
      },
      success: function (res) {
        console.log(res);
        var newdata = [];
        var data = res.data.info;
        console.log(data);
        for (var i in data) {
          var x = data[i].x;
          var y = data[i].y;
          var num = data[i].num;
        }
        console.log(x);
        console.log(y);
        console.log(num);
        data.forEach(v => {
          newdata.push([v.x,v.y,v.num])
        });
        console.log(newdata);

        barec.setOption({
          title: {
            text: '小二班教室平面图',
            subtext: '总长11.55米,总宽7.8米',
            left: 'center',
            textStyle: {
              color: '#000000'
            }
          },
          grid: {
            left: '7%',
            right: '7%',
            containLabel: true
          },
          tooltip: {
            // trigger: 'axis',
            showDelay: 0,
            formatter: function (params) {
              if (params.value.length > 1) {
                return params.seriesName + ' :<br/>'
                  + params.value[0] + 'm'
                  + params.value[1] + 'm';
              }
              else {
                return params.seriesName + ' :<br/>'
                  + params.name + ' : '
                  + params.value + 'm';
              }
            },
            axisPointer: {
              show: true,
              type: 'cross',
              lineStyle: {
                type: 'dashed',
                width: 1
              }
            }
          },
          xAxis: [
            {
              type: 'value',
              scale: true,
              axisLabel: {
                formatter: '{value}m'
              },
              splitLine: {
                show: false
              }
            }
          ],
          yAxis: [
            {
              type: 'value',
              scale: true,
              axisLabel: {
                formatter: '{value}m'
              },
              splitLine: {
                show: false
              }
            }
          ],
          visualMap: {
            min: 0,
            max: 10,
            calculable: true,
            orient: 'horizontal',
            left: 'center',
            inRange: {
              color: ['#50a3ba', '#eac736', '#d94e5d']
            },
            textStyle: {
              color: '#fff'
            }
          },
          series: [
          {
            name:'学生',
            data: newdata,
            type: 'scatter',
            pointSize: 5,
            blurSize: 6
          }
          ]
        })
        wx.hideLoading();
      },
      fail: function (res) { },
      complete: function (res) { },
    })
  }
});


