线性回归的梯度下降和正规方程组求解
1. 线性回归
在统计学中,线性回归(Linear Regression)是利用称为线性回归方程的最小平方函数对一个或多个自变量和因变量之间关系进行建模的一种回归分析。这种函数是一个或多个称为回归系数的模型参数的线性组合。
回归分析中,只包括一个自变量和一个因变量,且二者的关系可用一条直线近似表示,这种回归分析称为一元线性回归分析。如果回归分析中包括两个或两个以上的自变量,且因变量和自变量之间是线性关系,则称为多元线性回归分析。

2.最小二乘法

最小二乘法的本质是最小化系数矩阵所张成的向量空间到观测向量的欧式误差距离,即选一条直线,它使得每个点到直线的距离之和最小。
最小二乘法的一种常见的描述是残差满足正态分布的最大似然估计。
假设
得到的就是最小二乘法。
3.梯度下降

从选定的初始点,沿着梯度以步长下降,可以求得局部最小值。

只有一个训练样本时:

对m个训练实例:

运用这个规则直到收敛,就是批梯度下降算法。
随机梯度下降的思想是根据每个单独的训练样本来更新权值。

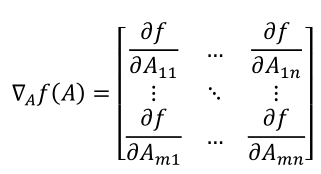
4.正规方程组
转自斯坦福大学机器学习公开课。


 1  # coding:utf-8
 2 import matplotlib.pyplot as plt
 3 import numpy as np
 4
 5 def dataN(length):
 6     x = np.zeros(shape = (length,2))
 7     y = np.zeros(shape = length)
 8     for i in range(0,length):
 9       x[i][0] = 1
10       x[i][1] = i
11       y[i] = (i + 25) + np.random.uniform(0,1) *10
12     return x,y
13
14 def alphA(x,y): #选取前20次迭代cost最小的alpha
15     c=float("inf")
16     for k in range(1,1000):
17             a=1.0/k**3
18             f=gD(x,y,20,a)[1][-1]
19             if f>c:
20                 break
21             c=f
22             alpha=a
23     return alpha
24
25 def gD(x,y,iter,alpha):#梯度下降
26     theta=np.ones(2)
27     cost=[]
28     for i in range(iter):
29         hypothesis = np.dot(x,theta)
30         loss = hypothesis - y
31         cost.append(np.sum(loss ** 2))
32         gradient = np.dot(x.transpose(),loss)
33         theta = theta -alpha * gradient
34     return theta,cost
35
36 def sgD(x,y,iter,alpha):#随机梯度下降
37     theta=np.ones(2)
38     cost=[]
39
40     for i in range(iter):
41         l=0
42         for j in range(0,len(y)):
43             loss=theta[1]*x[j][1]+theta[0]-y[j]
44             theta[1]=theta[1]-alpha*x[j][1]*loss
45             theta[0]=theta[0]-alpha*loss
46             l=l+loss**2
47         cost.append(l)
48     return theta,cost
49
50 def eQ(x,y):#正则方程组
51    x=np.matrix(x)
52    y=np.matrix(y).T
53    a=np.dot(x.T,x).I
54    b=np.dot(a,x.T)
55    c=np.dot(b,y)
56    return c
57
58 def exP(x,y):#一元线性回归拟合方程
59     xmean=np.mean(x)
60     ymean=np.mean(y)
61     b=np.sum([(x1-xmean)*(y1-ymean)for x1,y1 in zip(x,y)])/np.sum([(x1-xmean)**2 for x1 in x])
62     a=ymean-b*xmean
63     return a,b
64
65 length=100
66 iter=50000
67 x,y=dataN(length)
68 #theta,cost=sgD(x,y,iter,alphA(x,y))  #[ 30.24623439   0.99707473]
69 theta,cost=gD(x,y,iter,alphA(x,y))  #[ 30.17228028   0.99806093]
70 print theta
71 print eQ(x,y) #[[ 30.20320097][  0.99759475]]
72 print exP(x[:,1],y) #与正则方程组结果一致
73
74 plt.figure(1)
75 plt.plot(range(iter),cost)
76 plt.figure(2)
77 plt.plot(x[:,1],y,'b.')
78 plt.plot([0,length],[theta[0],theta[0]+length*theta[1]])
79 plt.show()


