ELK部署
1. elasticsearch部署
#官网安装:https://www.elastic.co/guide/
elasticsearch是一个基于Lucene的搜索服务器。它提供了一个分布式多用户能力的全文搜索引擎,基于RESTful web接口。Elasticsearch是用Java开发的,并作为Apache许可条款下的开放源码发布,是当前流行的企业级搜索引擎。设计用于云计算中,能够达到实时搜索,稳定,可靠,快速,安装使用方便。
最小化安装Centos 7.2 x86_64操作系统的虚拟机,vcpu 2,内存4G或更多,操作系统盘50G,主机名设置规则为node1,node2,其中host1和host2为elasticsearc,统一安装目录/home,各服务器配置本地域名解析:
[root@node1 src]# cat /etc/hosts
127.0.0.1   localhost localhost.localdomain localhost4 localhost4.localdomain4
::1         localhost localhost.localdomain localhost6 localhost6.localdomain6
10.10.16.213 node1
10.10.16.214 node2
#安装包统一放在/usr/local/src,这里都采用二进制方式安装。
1.1 下载安装包
在官网下载各种安装包:elasticSearch, logstash, kibna,前提是准备好jdk1.8的环境,安装jdk参考:https://www.cnblogs.com/qianjingchen/p/9547815.html
cd /usr/local/src
wget https://artifacts.elastic.co/downloads/elasticsearch/elasticsearch-6.5.4.tar.gz
wget https://artifacts.elastic.co/downloads/logstash/logstash-6.5.4.tar.gz
wget https://artifacts.elastic.co/downloads/kibana/kibana-6.5.4-linux-x86_64.tar.gz
tar xf elasticsearch-6.5.4.tar.gz
mv elasticsearch-6.5.4 /home/elasticsearch
1.2 创建普通用户和授权
注意,root用户是不能直接启动elasticsearch的,需要创建普通用户,用普通用户去启动elasticsearch服务
单点的话就在一台机器上部署es,kibana和logstash,如果是集群的话需要在其他节点都安装上elasticsearch
#创建elsearch用户组及elsearch用户:
groupadd elsearch
useradd elsearch -g elsearch -p elasticsearch  #-p 设置密码
mkdir /home/elasticsearch/{data,logs} -p #创建好数据目录和日志目录
chown -R elsearch:elsearch /home/elasticsearch
1.3 防报错处理
由于系统默认的配置为es分配的不合理,需要手动更改物理内存、系统进程数、系统open files限制
#linux资源限制配置文件:限制用户进程的数量,保证系统稳定性
cat /etc/security/limits.conf
* soft nofile 65536
* hard nofile 131072
* soft nproc 65536
* hard nproc 65536
* soft memlock unlimited
* hard memlock unlimited
#系统用户资源配置文件:/etc/security/limits.conf配置文件可限制文件打开数,系统进程等资源,在该文件配置中写的最大用户进程数是受/etc/security/limits.d/90-nproc.conf配置上限影响的
vim /etc/security/limits.d/90-nproc.conf
*          soft    nproc     4096
#系统最大打开文件描述符数
vim /etc/sysctl.conf
vm.max_map_count=262144
sysctl -p #执行生效
#配置文件调整jvm内存大小
vim config/jvm.options
-Xms2g
-Xmx2g
#elasticsearch官网建议生产环境需要设置bootstrap.memory_lock: true
由于Centos6不支持SecComp,而ES5.2.0默认bootstrap.system_call_filter为true进行检测,所以导致检测失败,失败后直接导致ES不能启动
vim elasticsearch.yml
bootstrap.memory_lock: false
bootstrap.system_call_filter: false
1.4 修改配置并启动
自定义数据和日志保存目录,开放端口号和请求地址
vim config/elasticsearch.yml
cluster.name: elasticsearch
node.name: node1
network.host: 0.0.0.0 #监听地址,生产环境建议写本机的ip
http.port: 9200
node.data: true #是否是数据节点
node.ingest: true #关闭即可
node.master: true #是否是主节点,不定义的话先启动的是主节点
node.max_local_storage_nodes: 1 #最大存储节点
path.data: /home/elasticsearch/data  #数据保存目录
path.logs: /home/elasticsearch/logs   #日志保存目
#服务启动的时候锁定足够的内存,防止数据写入swap
bootstrap.memory_lock: false
bootstrap.system_call_filter: false
###head插件相关###
http.cors.enabled: true
http.cors.allow-origin: "*"
http.cors.allow-headers: Authorization,X-Requested-With,Content-Length,Content-Type
###head插件相关####
#节点ip,节点之间要允许ping和9300端口通信,这里单节点暂时注释
#transport.tcp.port: 9300
#discovery.zen.ping.unicast.hosts: ["10.10.16.213", "10.10.16.214"]
#这里没有用到xpack,先注释掉,后面介绍
#xpack.security.enabled: true
#xpack.security.transport.ssl.enabled: true
基本配置优化完成之后,加入后台启动es,node2和node1配置一样,标红处改:node.name: node2 ; node.master: false
cd /home/elasticsearch
su elsearch
nohup sh bin/elasticsearch &
tailf nohup.out
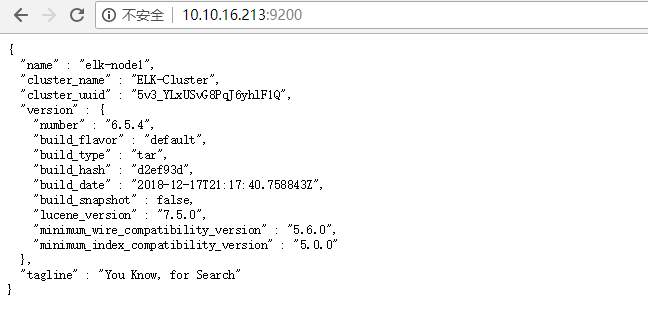
http://10.10.16.213:9200/ ,http://10.10.16.214:9200/ #访问
1.6 查看集群状态
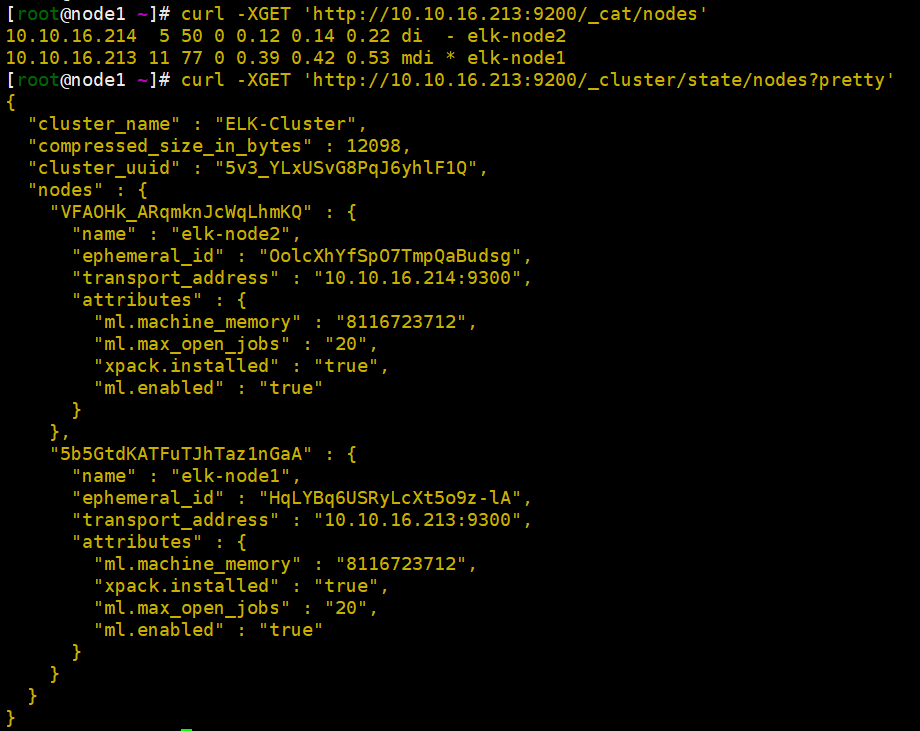
在任意一台es终端上执行,ip可以写localhost,也可以在浏览器上打开:
curl -XGET 'http://10.10.16.213:9200/_cat/nodes'  #查询集群节点状态
curl -XGET 'http://10.10.16.213:9200/_cluster/state/nodes?pretty' #查询集群状态
curl -XGET 'http://localhost:9200/_cluster/state/master_node?pretty'  #查看集群的master
curl -XGET 'http://localhost:9200/_cluster/state/master_node?pretty'   #查看集群的健康状态
1.7 elasticsearch-head安装(双节点)
elasticsearch-head是一个用于浏览ElasticSearch集群并与其进行交互的Web项目。
在elasticsearch 5.x版本以后不再支持直接安装head插件,而是需要通过启动一个服务方式,git地址:https://github.com/mobz/elasticsearch-head
elasticsearch-head插件是为了完成不同的功能,官方提供了一些插件但大部分是收费的,另外也有一些开发爱好者提供的插件,可以实现对elasticsearch集群的状态监控与管理配置等功能。安装与否看个人需求。
wget https://github.com/mobz/elasticsearch-head/archive/master.zip
unzip master.zip
mv elasticsearch-head-master /home/elasticsearch-head
cd /home/elasticsearch-head/
1.71 安装node
NPM的全称是Node Package Manager,是随同NodeJS一起安装的包管理和分发工具,它很方便让JavaScript开发者下载、安装、上传以及管理已经安装的包。
由于head插件本质上还是一个nodejs的工程,因此需要安装node,使用npm来安装依赖的包。(npm可以理解为maven)。
官网下载对应版本的node: https://nodejs.org/en/download/
wget https://nodejs.org/dist/v10.15.0/node-v10.15.0-linux-x64.tar.xz
yum -y install xz  #用xz工具解压node包
xz -d node-v10.15.0-linux-x64.tar.xz
tar xf node-v10.15.0-linux-x64.tar
mv node-v10.15.0-linux-x64 /usr/local/
tail -n2 /etc/profile
export NODE_HOME=/usr/local/node-v10.15.0-linux-x64/
export PATH=$PATH:$NODE_HOME/bin
source /etc/profile
这里nodejs已经安装上了,npm其实是Node.js的包管理工具,安装好node也顺便安装好了npm。
npm -v #查看版本,验证是否安装成功
6.4.1
node -v  #验证是否安装成功
v10.15.0
1.72 安装grunt
grunt是一个很方便的构建工具,可以进行打包压缩、测试、执行等等工作。由于head插件的执行文件是有grunt来执行的,所以必须安装。
npm install -g grunt-cli   #-g代表全局
npm install -g grunt
ll /usr/local/node-v10.15.0-linux-x64/lib/node_modules/grunt  #确认生成文件
grunt –version  #确认一下版本
cd /home/elasticsearch-head/
npm install     #执行安装head依赖包
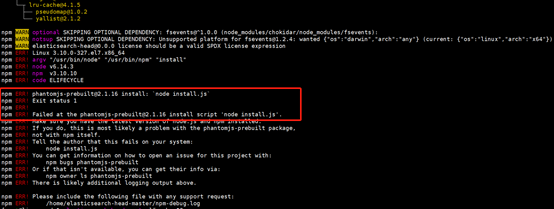
如果报错如上,请执行:npm install phantomjs-prebuilt@2.1.16 --ignore-scripts
编辑配置文件,修改相关属性,事集群可以正常通信
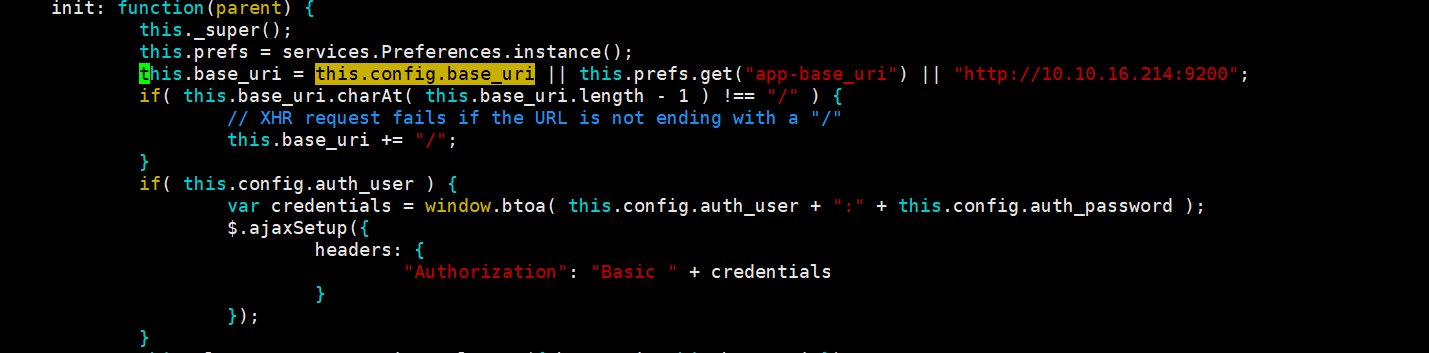
vim Gruntfile.js #增加hostname属性,设置为“*”,允许所有IP访问,如下图:

vim _site/app.js 文件:修改head的连接地址为自己的主机,如下图:
1.73 启动head
启动head,加入后台启动
#启动head,加上&可以加入后台启动
grunt server  >nohup.out &
tail -f nohup.out   #查看日志
如果提示未安装grunt-contrib-jasmine模块,执行如下:
npm install grunt-contrib-jasmine --registry=https://registry.npm.taobao.org #执行完成重新启动
1.74 开启跨域访问支持
开启跨域访问支持,在elasticsearch.yml中修改
vim /home/elasticsearch/config/elasticsearch.yml
http.cors.enabled: true   #es中启用cors,使之可以连接集群
http.cors.allow-origin: "*" #允许访问的ip地址段,*为所有
重启elasticsearch服务:注意先启动从节点的elasticsearch和grunt服务。
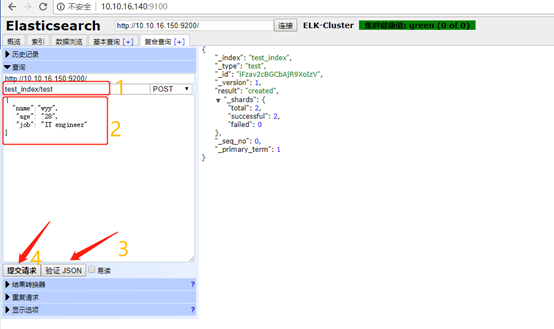
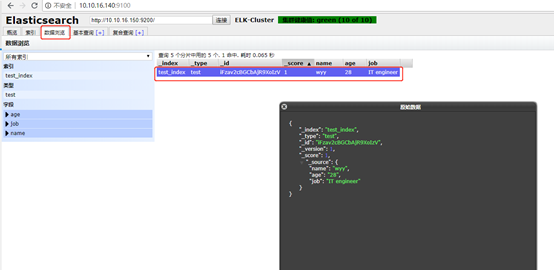
1.75 手动测试提交数据
截图只供参考:
查看数据
1.76 总结
master与slave的区别:
Master的职责:统计各node节点状态信息、集群状态信息统计、索引的创建和删除、索引分配的管理、关闭node节点等
Slave的职责:同步数据、等待机会成为Master
了解elasticsearch插件之kopf,kopf也是一个elasticsearch的管理工具,它提供了对ES集群操作的API。Git地址:https://github.com/lmenezes/elasticsearch-kopf
2. logstash部署
Logstash是一个开源的数据收集引擎,可以水平伸缩,而且logstash是整个ELK当中拥有最多插件的一个组件,其可以接收来自不同来源的数据并统一输出到指定的且可以是多个不同目的地。Logstash的运行依赖于Java环境运行,由于我们只是运行Java程序,而不是开发,下载JRE即可。在Oracle官方下载新版jre,下载地址:http://www.oracle.com/technetwork/java/javase/downloads/jre8-downloads-2133155.html
2.1 解压安装包
logstash是ELK中负责收集和过滤日志的。直接解压从官网下载的安装包
cd /usr/local/src
tar xf  logstash-6.5.4.tar.gz
mv logstash-6.5.4 /home/logstash
mkdir /home/logstash/conf
2.2 测试标准输入和输出
执行logstash让日志输出到屏幕
cd /home/logstash
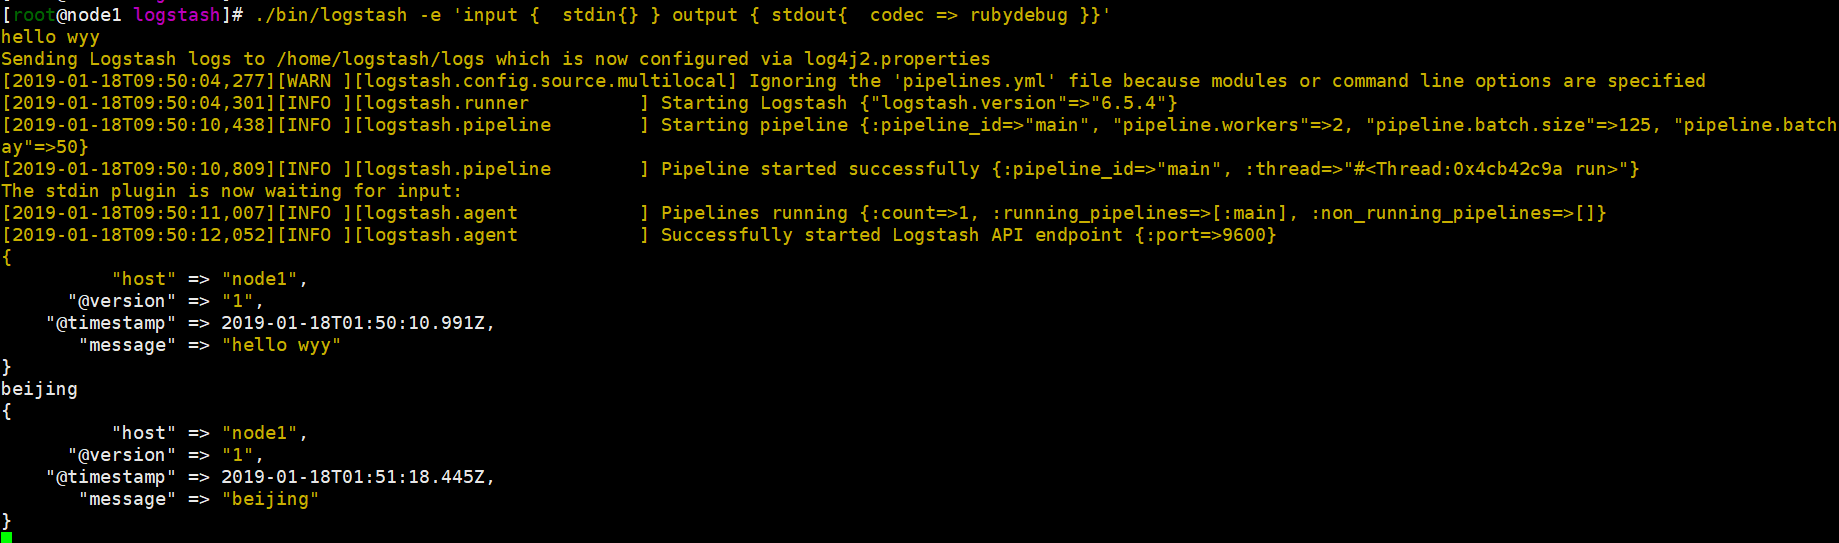
./bin/logstash -e 'input { stdin{} } output { stdout{ codec => rubydebug }}'
hello wyy #随便输入内容
结果会打印出来,证明logstash安装成功!“host” 标记时间发生在哪里;“@version”事件版本号,一个事件就是一个ruby对象;“@timestamp”当前事件发生的时间;“message”消息的具体内容。
2.3 测试输出到文件
将测试输出的message输出到一个文件进行保存
./bin/logstash -e 'input {  stdin{} } output { file { path => "/tmp/log-%{+YYYY.MM.dd}messages.gz"}}'
Every man is his own worst enemy! #输入你想表达的内容
[2019-01-18T09:59:32,806][INFO ][logstash.outputs.file    ] Opening file {:path=>"/tmp/log-2019.01.18messages.gz"}
打开文件验证:
[root@node1 tmp]# tail log-2019.01.18messages.gz
{"@timestamp":"2019-01-18T01:59:32.405Z","message":"Every man is his own worst enemy!","host":"node1","@version":"1"}
2.4 测试输出到elasticsearch
将内容输写到elasticsearch,可通过elasticsearch-head插件看到新建的索引
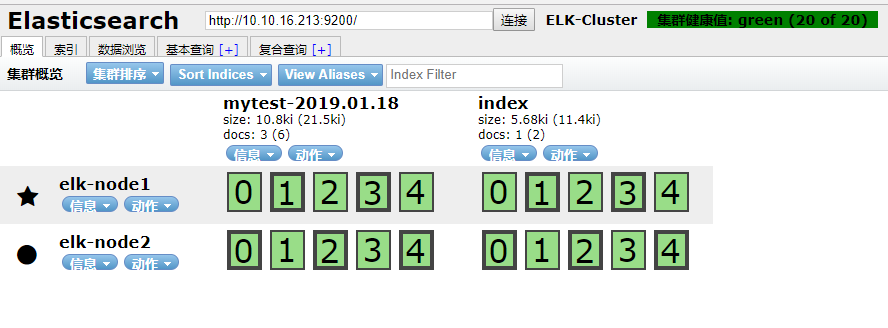
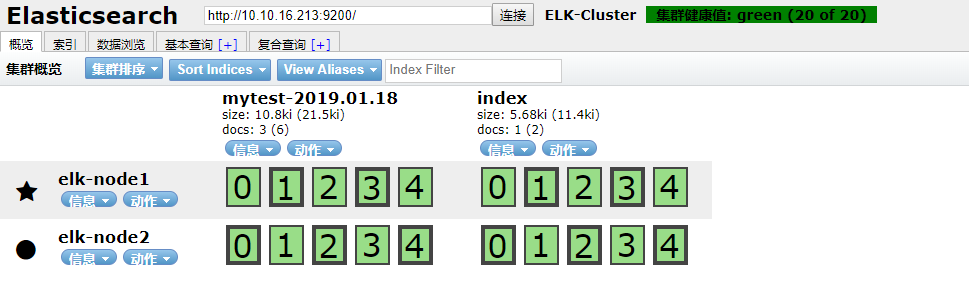
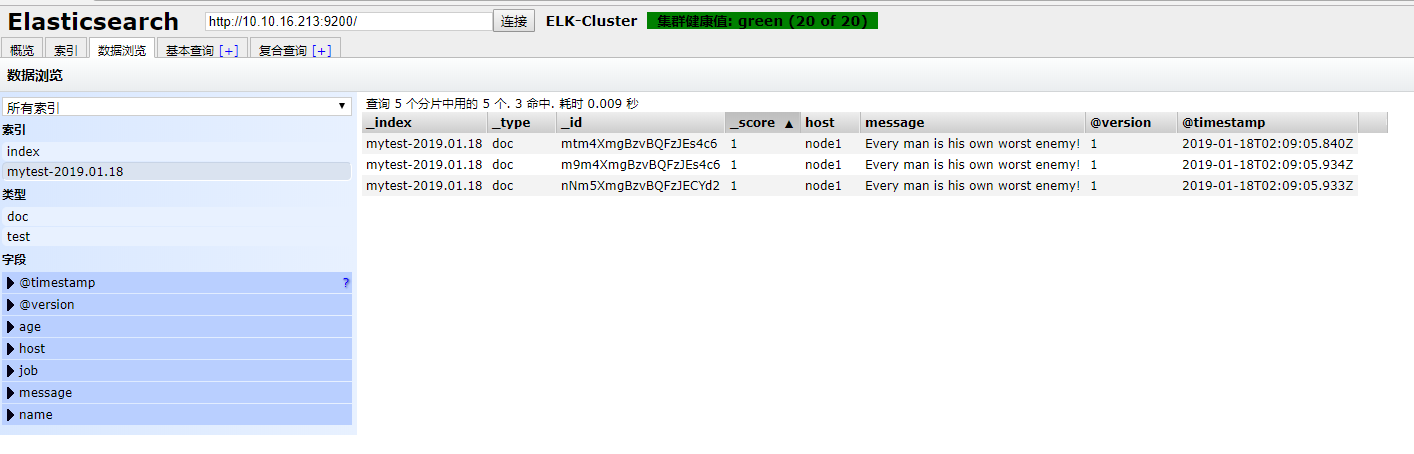
./bin/logstash -e 'input {  stdin{} } output { elasticsearch {hosts => ["10.10.16.213:9200"] index => "mytest-%{+YYYY.MM.dd}" }}'
Every man is his own worst enemy!
Every man is his own worst enemy!
Every man is his own worst enemy!
http://10.10.16.213:9100/ #打开node1节点,查看索引,数据浏览
注意:master收集到日志后,会把一部分数据碎片到salve上(随机的一部分数据),master和slave又都会各自做副本,并把副本放到对方机器上,这样就保证了数据不会丢失。
2.5 elasticsearch主机上验证数据
ll /home/elasticsearch/data/nodes/0/indices/ #所有的数据都会保存在这个目录
2.6 测试收集系统日志
如果想收集某台服务器的系统日志,前提是需要在那台机器上装上logstash,这里就在本台测试。配置文件非常简单:
编写好配置文件,我这里单独建好了一个conf目录
cd /home/logstash/conf
cat logstash001.conf
input {
    file {
      path => "/var/log/messages"
      type => "system"
      start_position => "beginning"
    }
}

output {
    elasticsearch {
       hosts => ["10.10.16.213:9200"]
       index => "system-%{+YYYY.MM.dd}"
    }
}
检查语法是否有误
[root@node1 logstash]# ./bin/logstash -f conf/logstash001.conf -t
Sending Logstash logs to /home/logstash/logs which is now configured via log4j2.properties
[2019-01-18T11:36:03,831][WARN ][logstash.config.source.multilocal] Ignoring the 'pipelines.yml' file because modules or command line options are specified
Configuration OK
[2019-01-18T11:36:07,499][INFO ][logstash.runner          ] Using config.test_and_exit mode. Config Validation Result: OK. Exiting Logstash
直接加入后台启动,查看输出日志:
[root@node1 logstash]# nohup sh  bin/logstash -f conf/logstash001.conf &
[root@node1 logstash]# tailif nohup.out
Sending Logstash logs to /home/logstash/logs which is now configured via log4j2.properties
[2019-01-18T11:37:03,041][WARN ][logstash.config.source.multilocal] Ignoring the 'pipelines.yml' file because modules or command line options are specified
[2019-01-18T11:37:03,084][INFO ][logstash.runner          ] Starting Logstash {"logstash.version"=>"6.5.4"}
[2019-01-18T11:37:08,155][INFO ][logstash.pipeline        ] Starting pipeline {:pipeline_id=>"main", "pipeline.workers"=>2, "pipeline.batch.size"=>125, "pipeline.batch.delay"=>50}
[2019-01-18T11:37:09,342][INFO ][logstash.outputs.elasticsearch] Elasticsearch pool URLs updated {:changes=>{:removed=>[], :added=>[http://10.10.16.213:9200/]}}
[2019-01-18T11:37:09,733][WARN ][logstash.outputs.elasticsearch] Restored connection to ES instance {:url=>"http://10.10.16.213:9200/"}
[2019-01-18T11:37:09,839][INFO ][logstash.outputs.elasticsearch] ES Output version determined {:es_version=>6}
[2019-01-18T11:37:09,845][WARN ][logstash.outputs.elasticsearch] Detected a 6.x and above cluster: the `type` event field won't be used to determine the document _type {:es_version=>6}
[2019-01-18T11:37:09,894][INFO ][logstash.outputs.elasticsearch] New Elasticsearch output {:class=>"LogStash::Outputs::ElasticSearch", :hosts=>["//10.10.16.213:9200"]}
[2019-01-18T11:37:09,937][INFO ][logstash.outputs.elasticsearch] Using mapping template from {:path=>nil}
[2019-01-18T11:37:09,969][INFO ][logstash.outputs.elasticsearch] Attempting to install template {:manage_template=>{"template"=>"logstash-*", "version"=>60001, "settings"=>{"index.refresh_interval"=>"5s"}, "mappings"=>{"_default_"=>{"dynamic_templates"=>[{"message_field"=>{"path_match"=>"message", "match_mapping_type"=>"string", "mapping"=>{"type"=>"text", "norms"=>false}}}, {"string_fields"=>{"match"=>"*", "match_mapping_type"=>"string", "mapping"=>{"type"=>"text", "norms"=>false, "fields"=>{"keyword"=>{"type"=>"keyword", "ignore_above"=>256}}}}}], "properties"=>{"@timestamp"=>{"type"=>"date"}, "@version"=>{"type"=>"keyword"}, "geoip"=>{"dynamic"=>true, "properties"=>{"ip"=>{"type"=>"ip"}, "location"=>{"type"=>"geo_point"}, "latitude"=>{"type"=>"half_float"}, "longitude"=>{"type"=>"half_float"}}}}}}}}
[2019-01-18T11:37:10,329][INFO ][logstash.inputs.file     ] No sincedb_path set, generating one based on the "path" setting {:sincedb_path=>"/home/logstash/data/plugins/inputs/file/.sincedb_452905a167cf4509fd08acb964fdb20c", :path=>["/var/log/messages"]}
[2019-01-18T11:37:10,401][INFO ][logstash.pipeline        ] Pipeline started successfully {:pipeline_id=>"main", :thread=>"#<Thread:0x60d1c0b run>"}
[2019-01-18T11:37:10,590][INFO ][logstash.agent           ] Pipelines running {:count=>1, :running_pipelines=>[:main], :non_running_pipelines=>[]}
[2019-01-18T11:37:10,623][INFO ][filewatch.observingtail  ] START, creating Discoverer, Watch with file and sincedb collections
[2019-01-18T11:37:11,597][INFO ][logstash.agent           ] Successfully started Logstash API endpoint {:port=>9600}
[2019-01-18T11:38:13,416][WARN ][logstash.outputs.elasticsearch] Marking url as dead. Last error: [LogStash::Outputs::ElasticSearch::HttpClient::Pool::HostUnreachableError] Elasticsearch Unreachable: [http://10.10.16.213:9200/][Manticore::SocketTimeout] Read timed out {:url=>http://10.10.16.213:9200/, :error_message=>"Elasticsearch Unreachable: [http://10.10.16.213:9200/][Manticore::SocketTimeout] Read timed out", :error_class=>"LogStash::Outputs::ElasticSearch::HttpClient::Pool::HostUnreachableError"}
[2019-01-18T11:38:13,436][WARN ][logstash.outputs.elasticsearch] Marking url as dead. Last error: [LogStash::Outputs::ElasticSearch::HttpClient::Pool::HostUnreachableError] Elasticsearch Unreachable: [http://10.10.16.213:9200/][Manticore::SocketTimeout] Read timed out {:url=>http://10.10.16.213:9200/, :error_message=>"Elasticsearch Unreachable: [http://10.10.16.213:9200/][Manticore::SocketTimeout] Read timed out", :error_class=>"LogStash::Outputs::ElasticSearch::HttpClient::Pool::HostUnreachableError"}
[2019-01-18T11:38:13,574][ERROR][logstash.outputs.elasticsearch] Attempted to send a bulk request to elasticsearch' but Elasticsearch appears to be unreachable or down! {:error_message=>"Elasticsearch Unreachable: [http://10.10.16.213:9200/][Manticore::SocketTimeout] Read timed out", :class=>"LogStash::Outputs::ElasticSearch::HttpClient::Pool::HostUnreachableError", :will_retry_in_seconds=>2}
[2019-01-18T11:38:13,591][ERROR][logstash.outputs.elasticsearch] Attempted to send a bulk request to elasticsearch' but Elasticsearch appears to be unreachable or down! {:error_message=>"Elasticsearch Unreachable: [http://10.10.16.213:9200/][Manticore::SocketTimeout] Read timed out", :class=>"LogStash::Outputs::ElasticSearch::HttpClient::Pool::HostUnreachableError", :will_retry_in_seconds=>2}
[2019-01-18T11:38:14,930][WARN ][logstash.outputs.elasticsearch] Restored connection to ES instance {:url=>"http://10.10.16.213:9200/"}
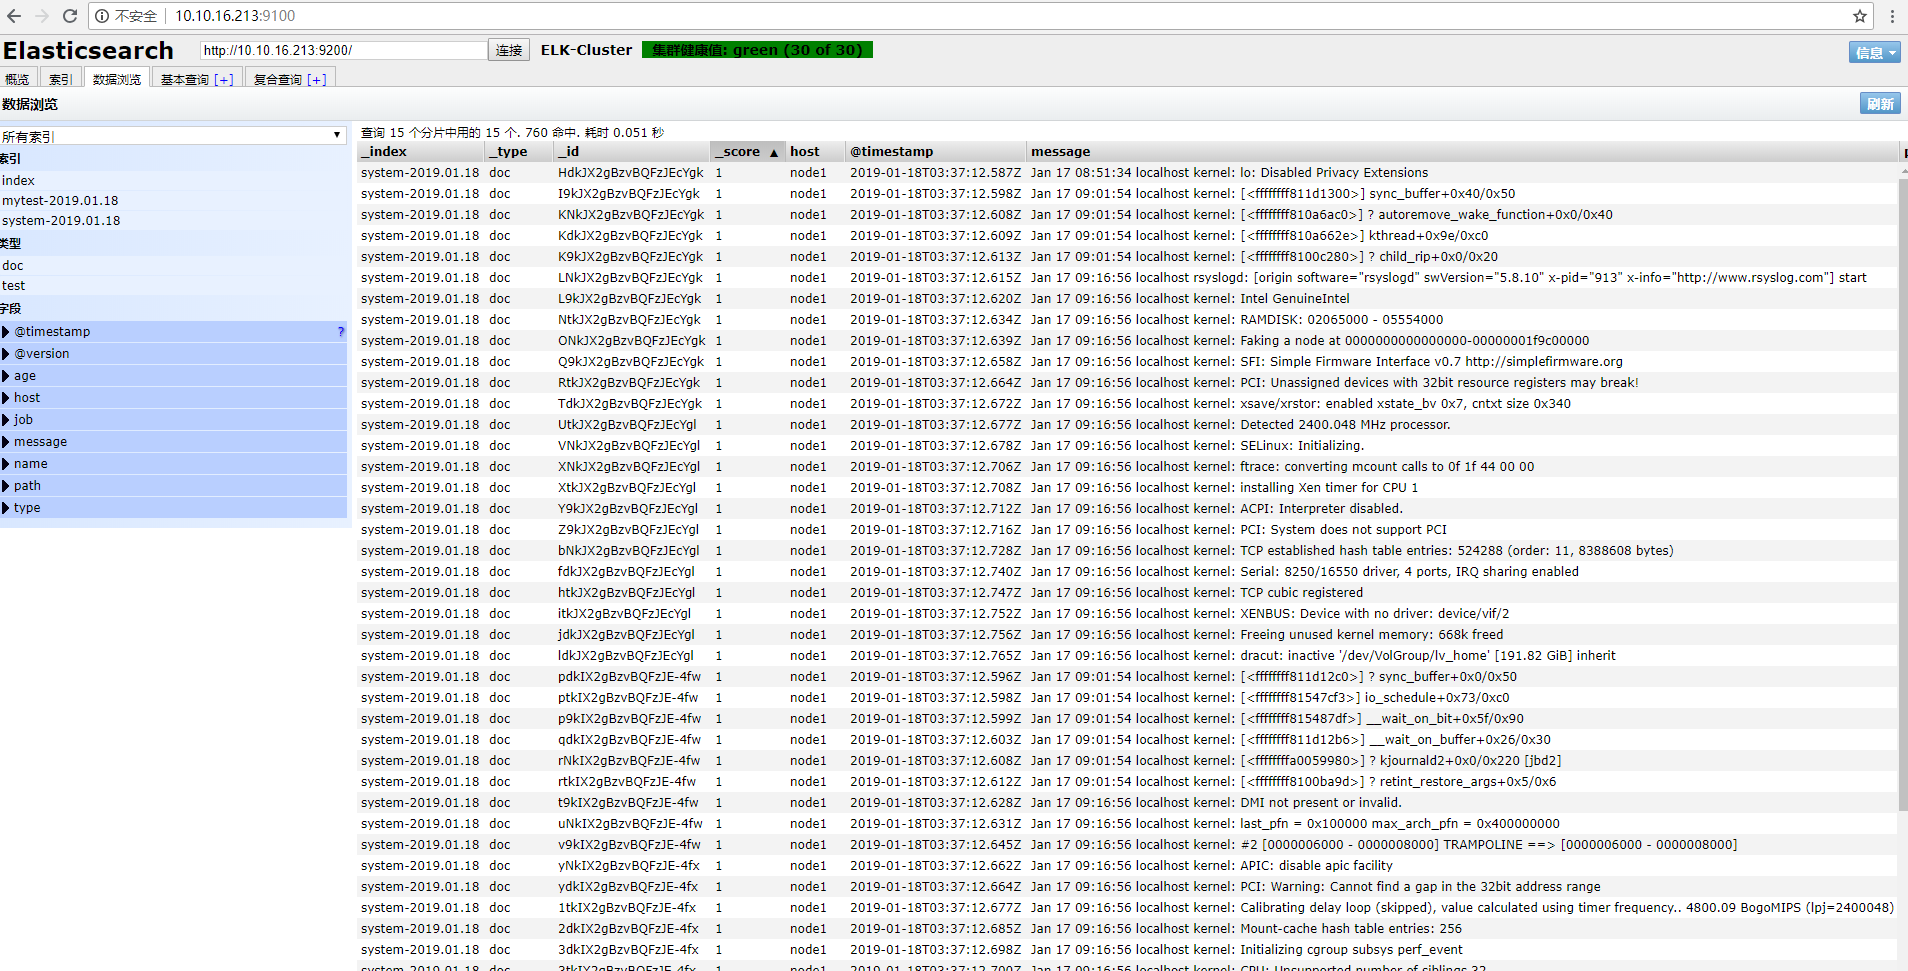
登录elasticsearch查看
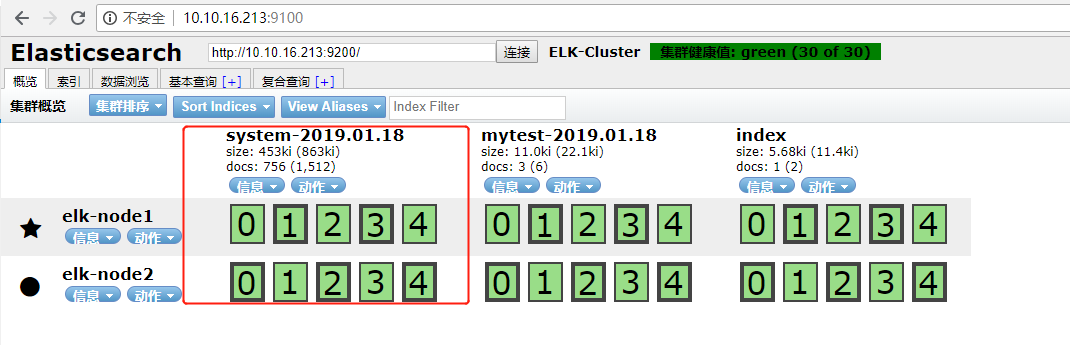
找到数据浏览,点击system-2019.01.18,查看日志:
2.7 测试收集线上tomcat日志
收集线上Java日志,我这里是一台rsyslog日志服务器,部署rsyslog请参考:https://www.cnblogs.com/qianjingchen/articles/9667113.html
这里直接配置,从本地拿到业务日志
vim /home/logstash/conflogstash001.conf  #写入内容(监听tomcat的日志)
input {
    file {
        path => "/home/yaoduwww/rsyslog/101.201.123.222/channelmanage/manager-e_nohup_2019-01-0*.log"
        start_position => beginning
    }
}
filter {

}
output {
    elasticsearch {
    hosts => "localhost:9200"
    index => "manager-entrance-%{+YYYY.MM.dd}"
    }

}

#进入logstash目录启动
sh bin/logstash -f conf/logstash1.conf -t #检查配置语法是否有误
nohup sh bin/logstash -f conf/logstash1.conf & #回车,加入后台启动
tailf nohup.out
3. kibana部署
Kibana是一个通过调用elasticsearch服务器进行图形化展示搜索结果的开源项目。
同样通过二进制方式安装,解压,修改配置
cd /usr/local/src
tar xf kibana-6.5.4-linux-x86_64.tar.gz
mv kibana-6.5.4-linux-x86_64 /home/kibana
cd /home/kibana
egrep -v "^$|#" config/kibana.yml
server.port: 5601
server.host: "10.10.16.213" #监听地址,生产环境不建议写"0.0.0.0"
elasticsearch.url: "http://10.10.16.213:9200"
kibana.index: ".kibana"
#加入后台启动
nohup sh bin/kibana &
tailf nohup.out
#注意:如果关闭kibana,需关闭node
ps -ef|grep node
root      3349  3269  1 15:15 pts/3    00:03:07 bin/../node/bin/node --no-warnings bin/../src/cli
kill -9 3349 #即可关闭
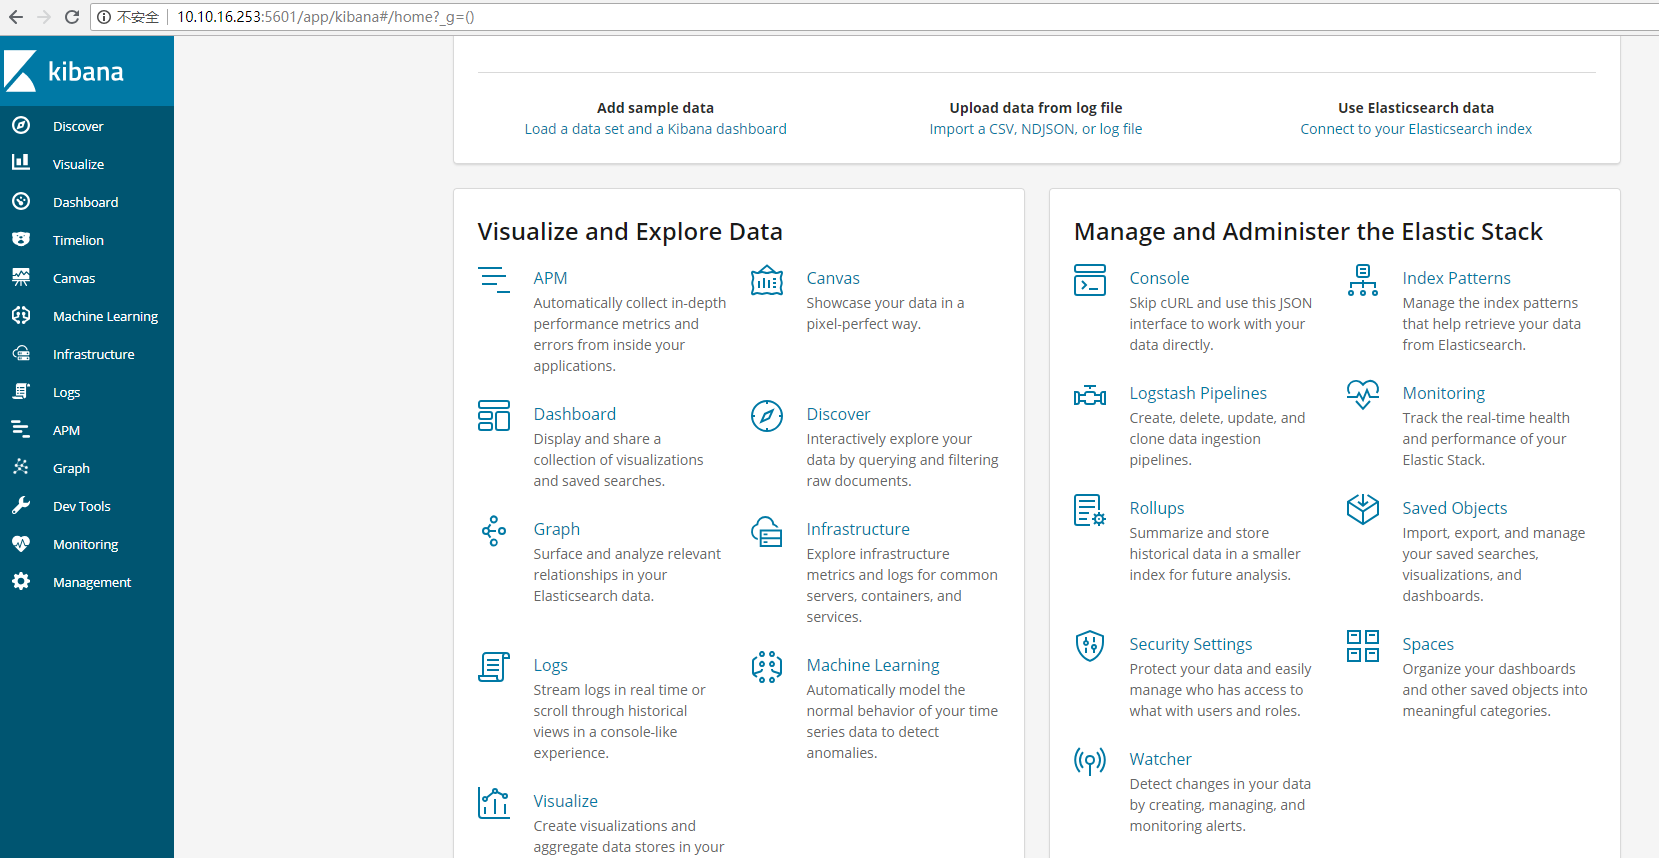
http://10.10.16.213:5601 #访问,默认没有设置过用户权限,可以直接访问界面;第三张截图是我安装过xpack的,功能会更多,对比一下:
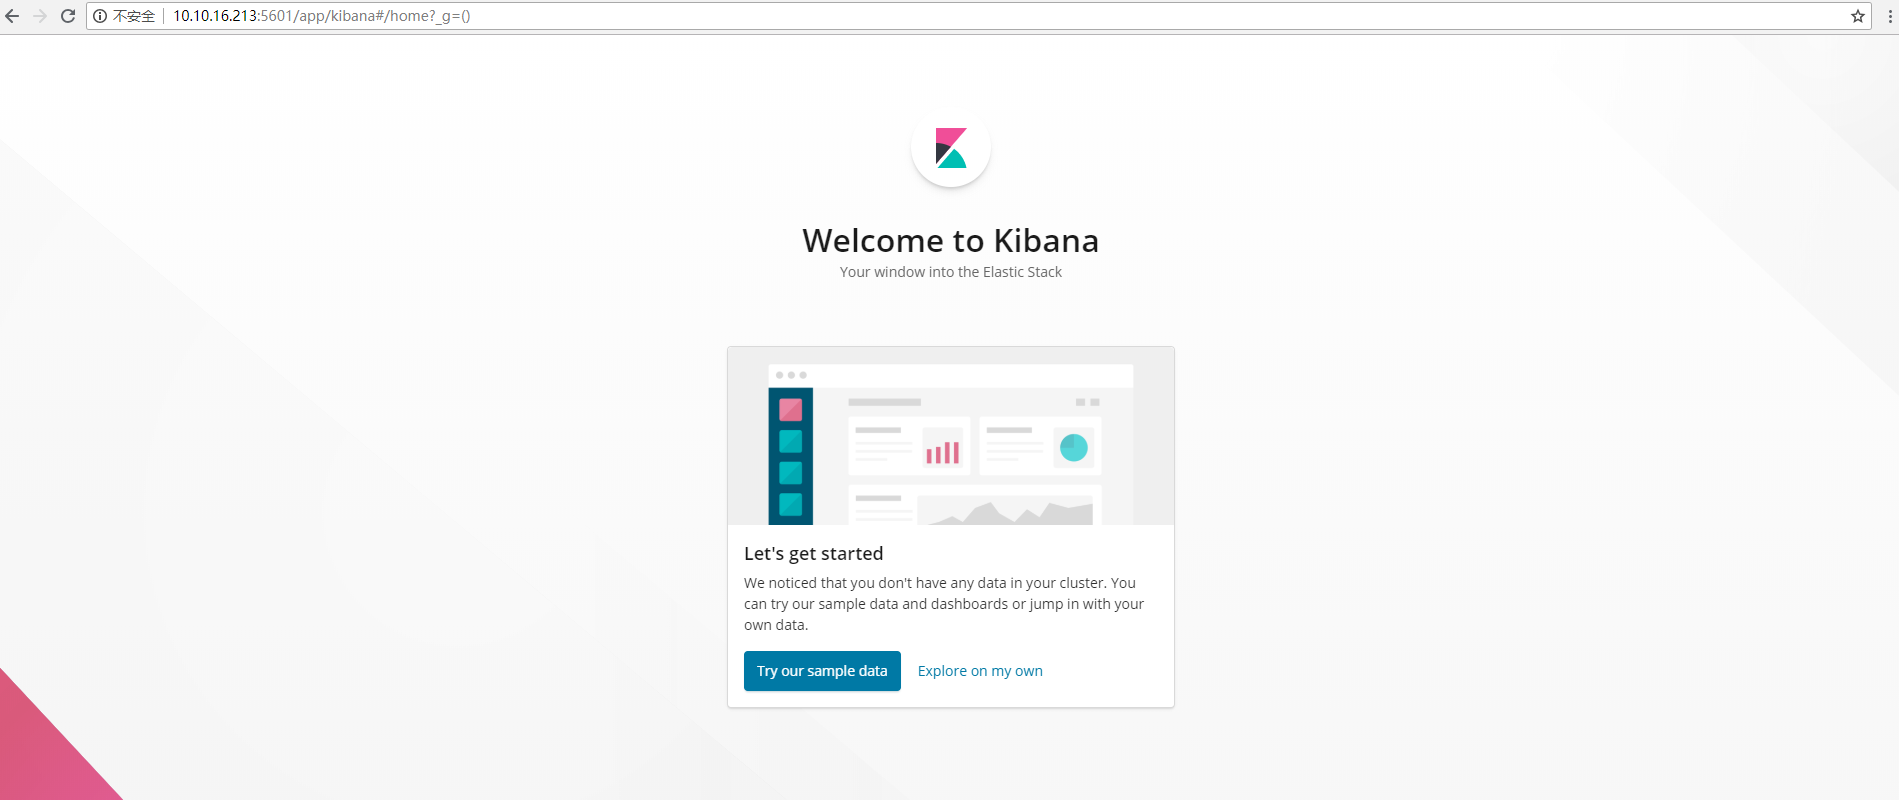
#选择自定义的
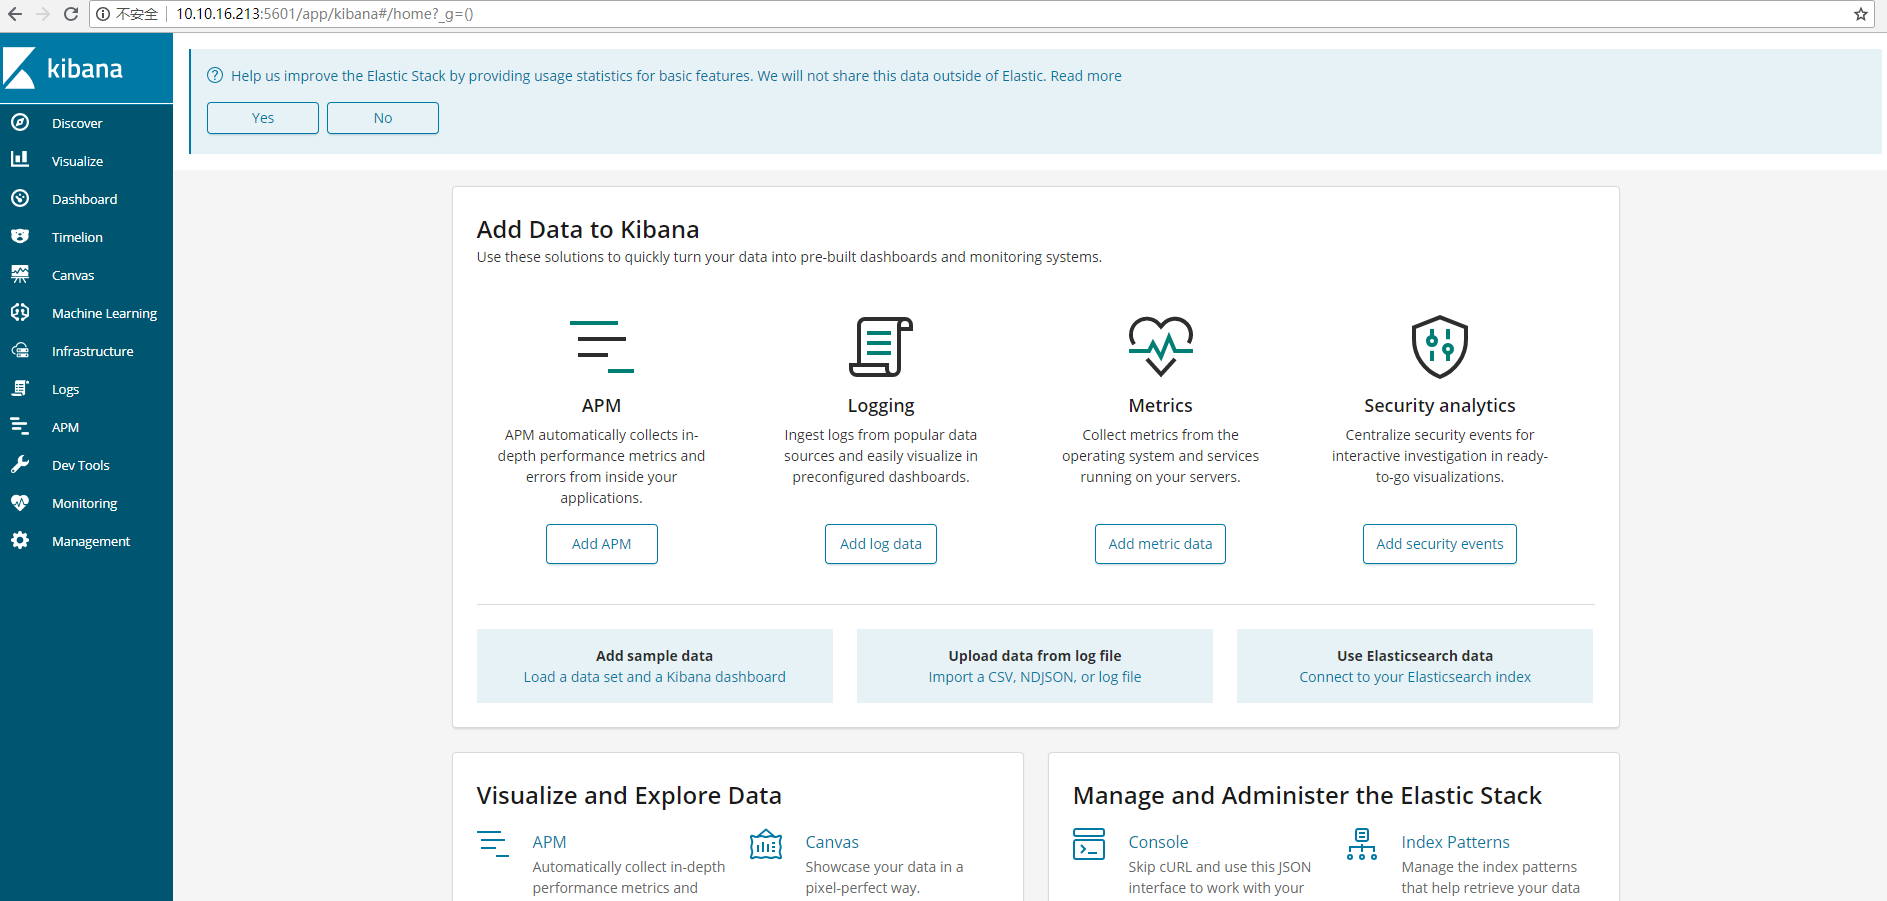
#这个是安装过xpack的,后面再介绍xpack安装和使用:
#至此elk基本部署已完成。下面创建索引
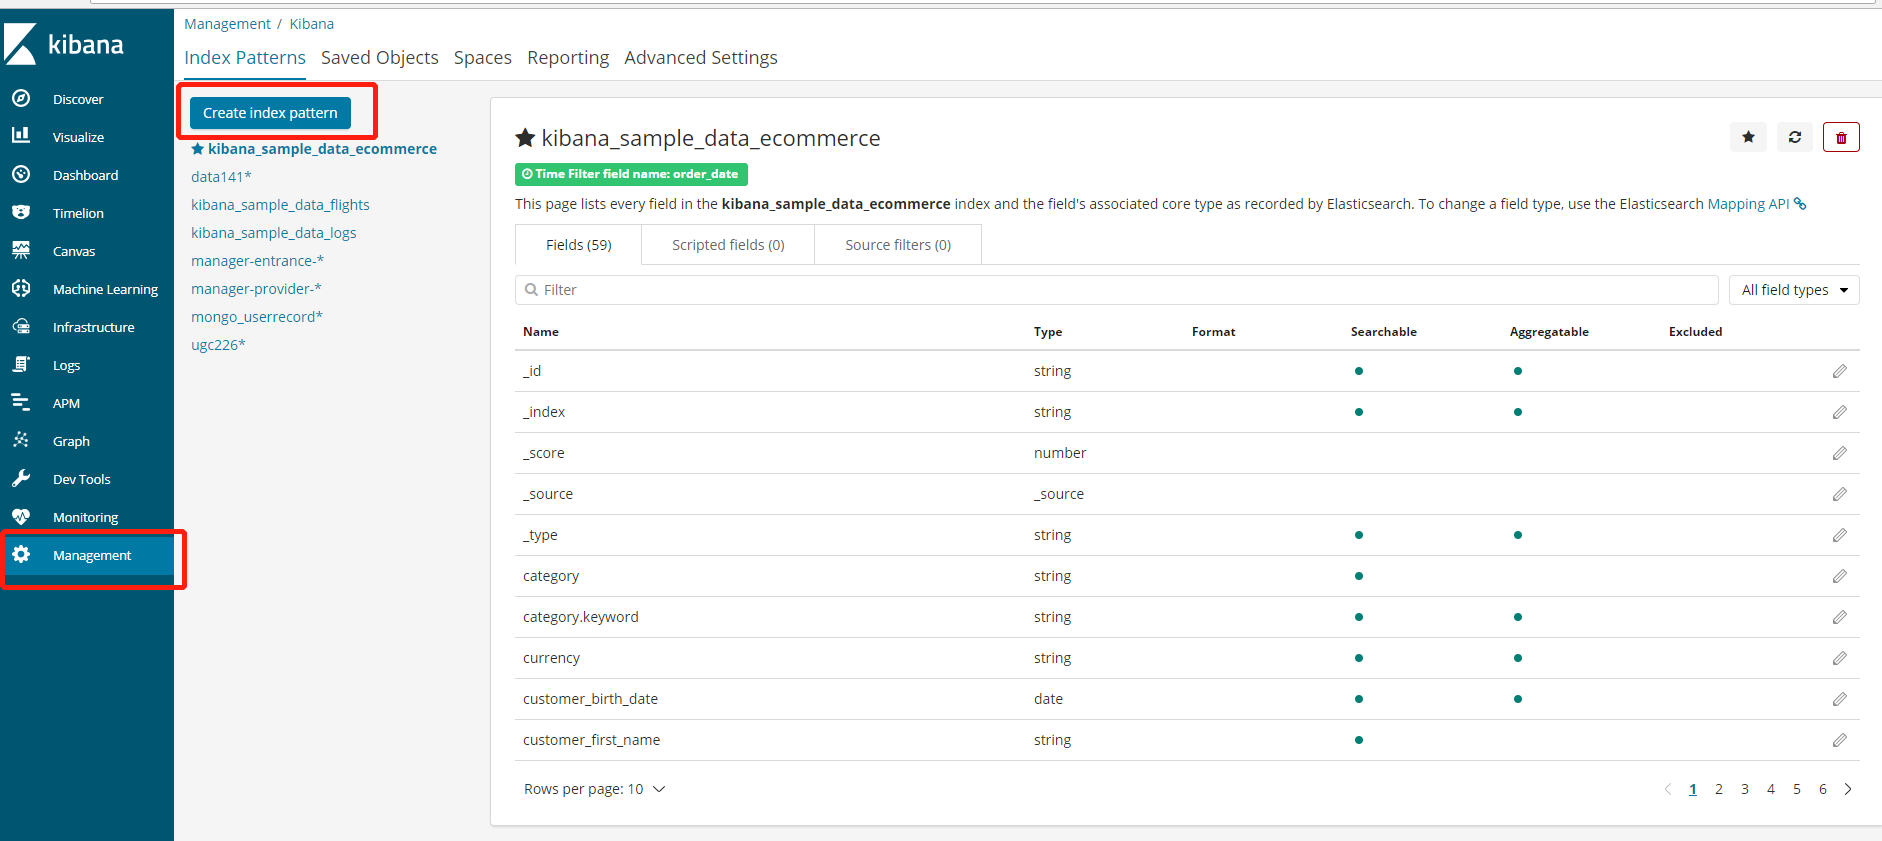
3.1 添加上一步写入的索引
找到management选项,在kibana里添加新的索引
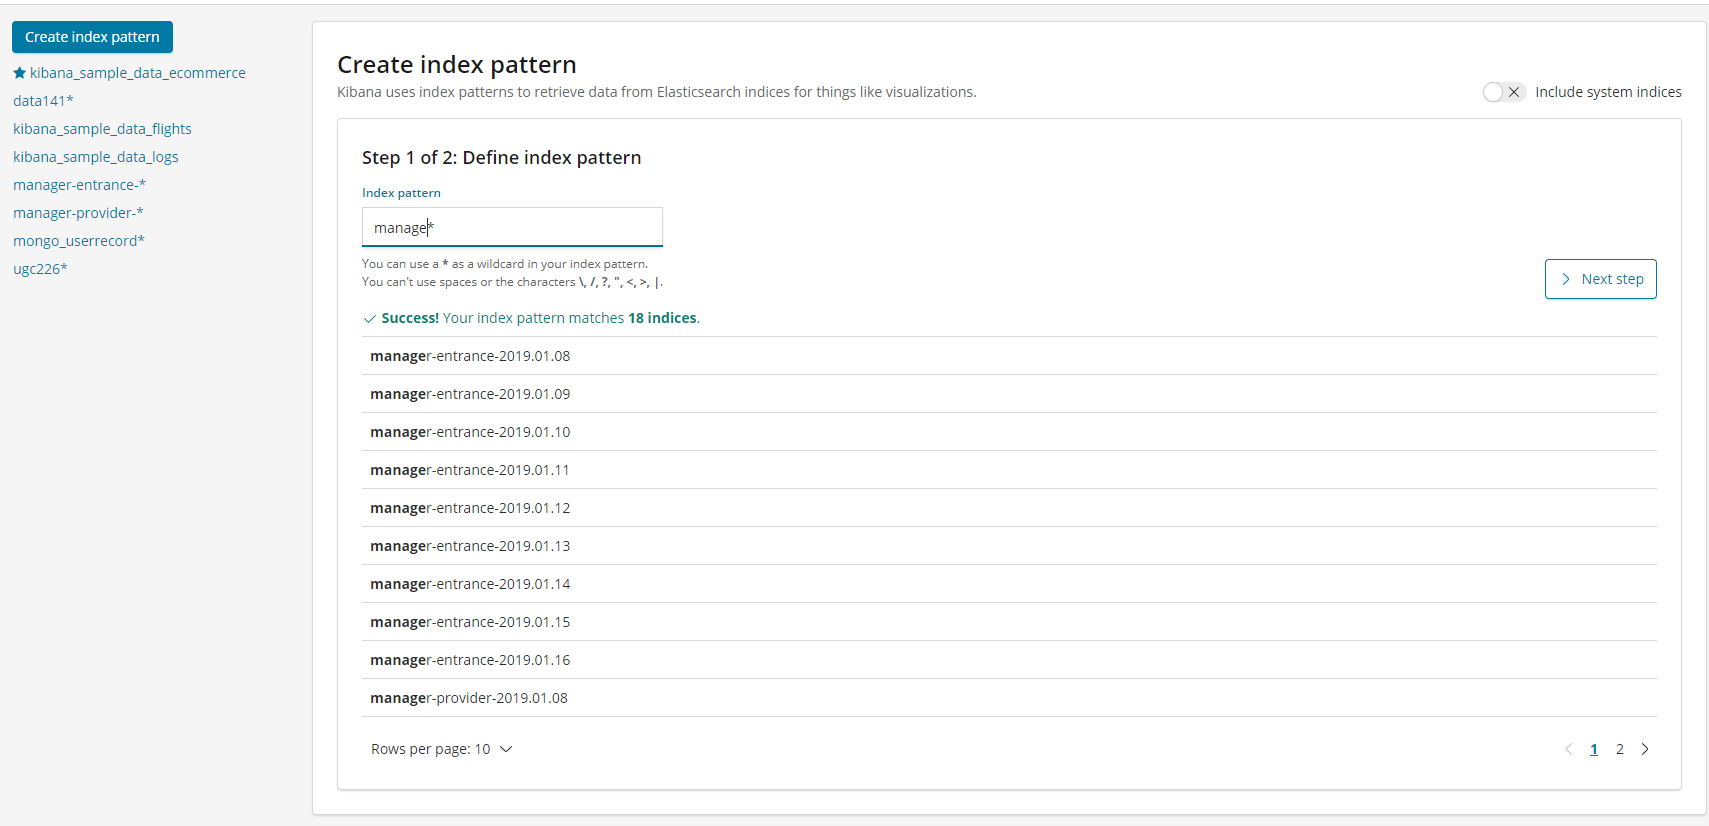
选择索引日期格式类型,时间戳为@timestamp或logdate,直接下一步操作,最后创建成功
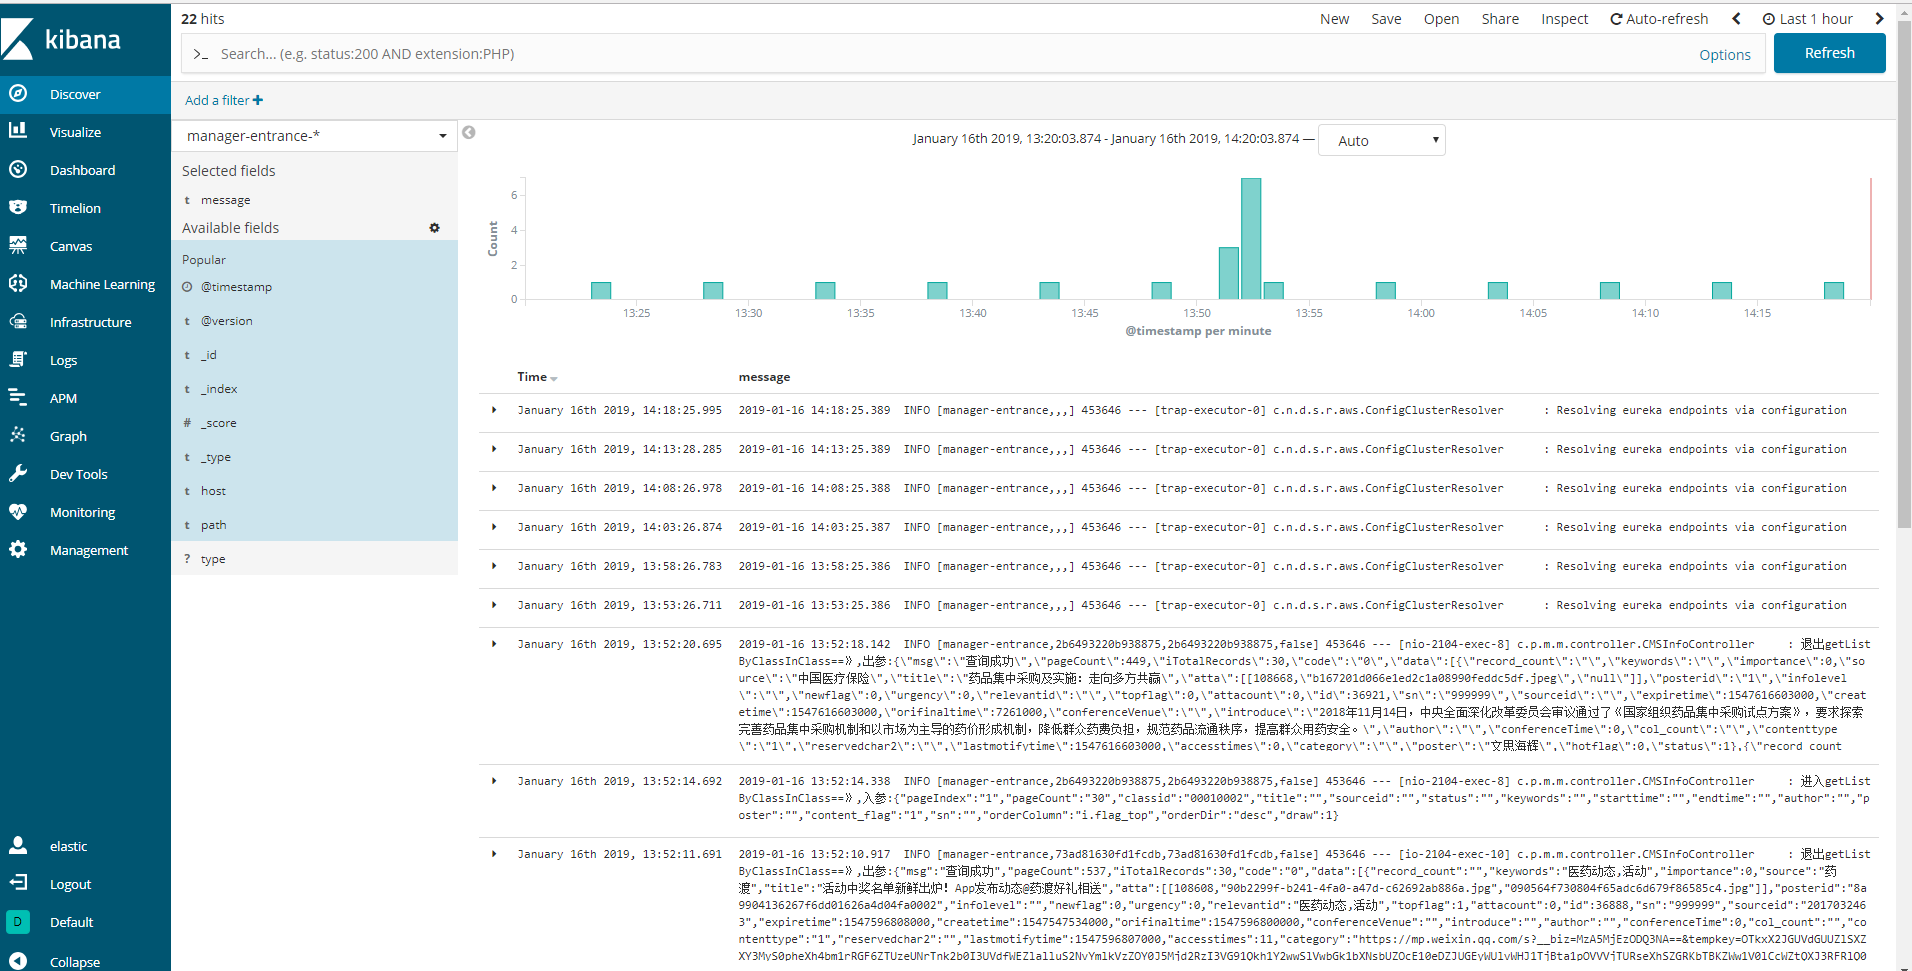
3.2 kibana验证数据
在首页发现选项里可以找到刚刚创建的索引:如果默认没有显示柱状的图,可能是最近没有写入新的数据,可以查看较长日期当中的数据或者通过logstash新写入数据即可。