matplotlib---调整坐标轴
1.调整坐标轴
import matplotlib.pyplot as plt
import numpy as np
# 绘制普通图像
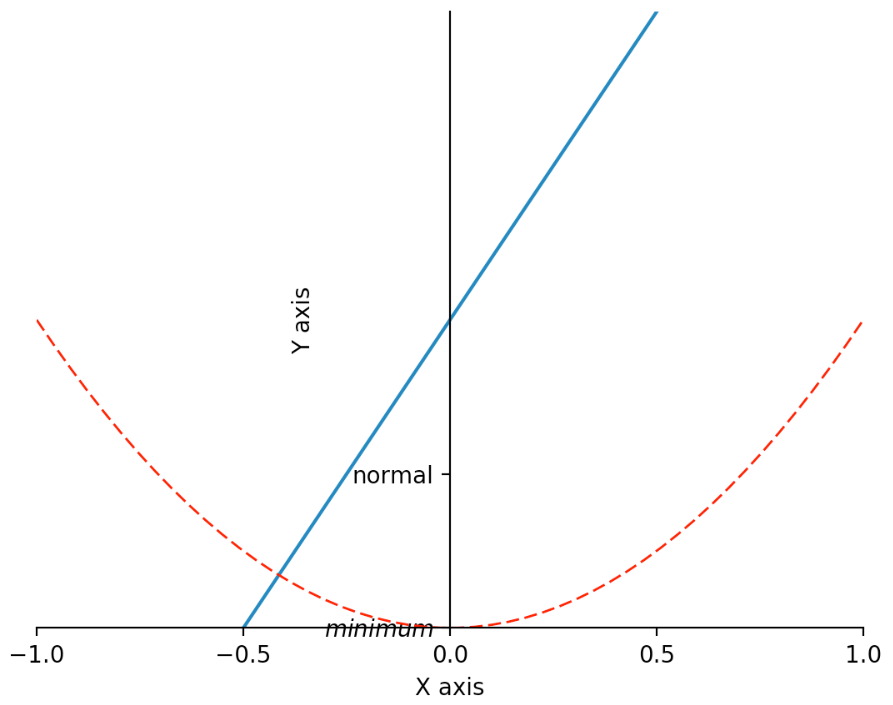
x = np.linspace(-1, 1, 50)
y1 = 2 * x + 1
y2 = x**2
plt.figure()
plt.plot(x, y1)
plt.plot(x, y2, color = 'red', linewidth = 1.0, linestyle = '--')
# 设置坐标轴的取值范围
plt.xlim((-1, 1))
plt.ylim((0, 2))
# 设置坐标轴的lable
plt.xlabel('X axis')
plt.ylabel('Y axis')
# 设置x坐标轴刻度, 原来为0.25, 修改后为0.5
plt.xticks(np.linspace(-1, 1, 5))
# 设置y坐标轴刻度及标签, $$是设置字体
plt.yticks([0, 0.5], ['$minimum$', 'normal'])
# 获取当前的坐标轴, gca = get current axis
ax = plt.gca()
# 设置右边框和上边框
ax.spines['right'].set_color('none')
ax.spines['top'].set_color('none')
# 设置x坐标轴为下边框
ax.xaxis.set_ticks_position('bottom')
# 设置y坐标轴为左边框
ax.yaxis.set_ticks_position('left')
# 设置x轴, y轴在(0, 0)的位置
ax.spines['bottom'].set_position(('data', 0))
ax.spines['left'].set_position(('data', 0))
plt.show()
参考文献: