【boke】(1) bokeh用figure画图
实验环境:win 7 python3.5.2 bokeh 0.13.0
时间:2018-08-06
一、bokeh 画线
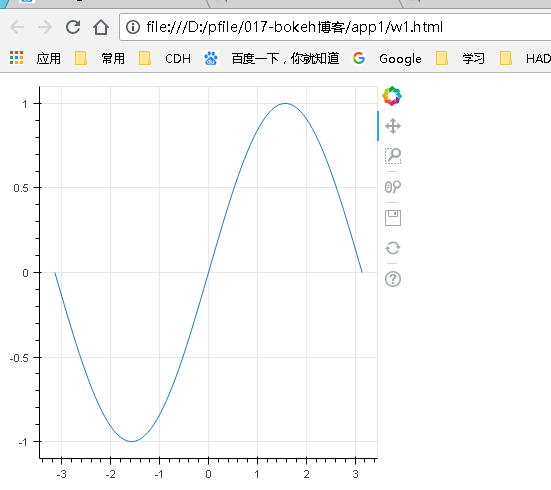
1)正弦曲线
from bokeh.plotting import figure,show
import numpy as np
x=np.linspace(-np.pi,np.pi,100)
y=np.sin(x)
p=figure(plot_width=400,plot_height=400)
p.line(x,y)
show(p)
会自动在当前文件加下产生一个同名html,并在浏览器里显示
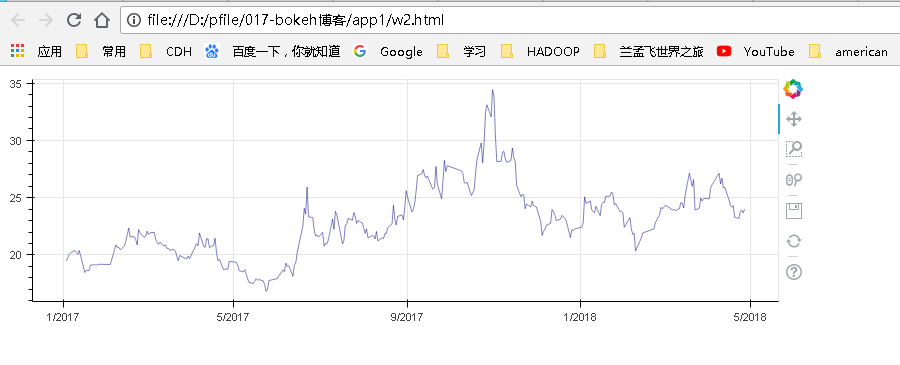
2) 支持padans 数据类型
import pandas as pd
from bokeh.plotting import figure, show
import tushare as ts
df=ts.get_hist_data('600848',start='2017-01-01',end='2018-05-01')
p = figure(plot_width=800, plot_height=250, x_axis_type="datetime")
p.line(pd.to_datetime(df.index), df['close'], color='navy', alpha=0.5)
show(p)
二、figure line 和circle 多种元素同图
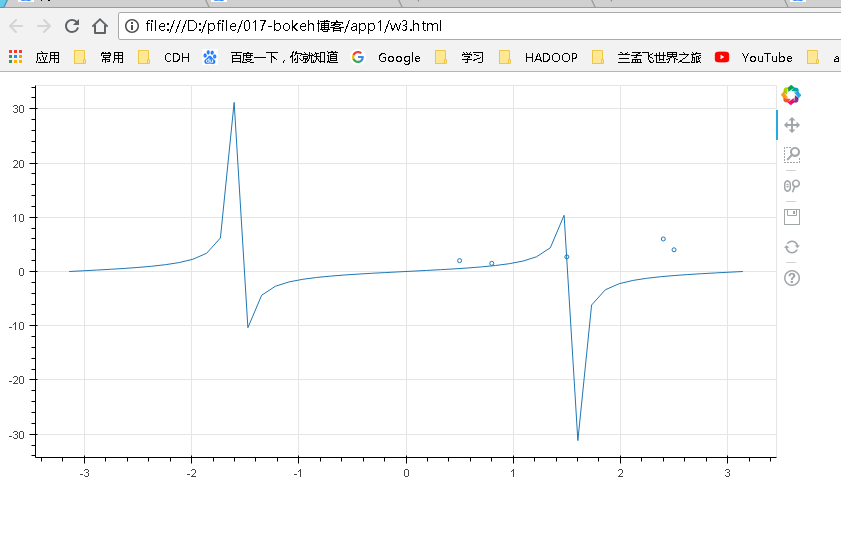
1) 多个元素可以同一个plot
from bokeh.plotting import figure, show
import numpy as np
x=[0.5,0.8,1.5,2.5,2.4]
y=[2,1.5,2.7,4,6]
p=figure(plot_width=800,plot_height=400)
p.circle(x,y,fill_color='white')
x1=np.linspace(-np.pi,np.pi,50)
y1=np.tan(x1)
p.line(x1,y1)
show(p)
2) 其它元素
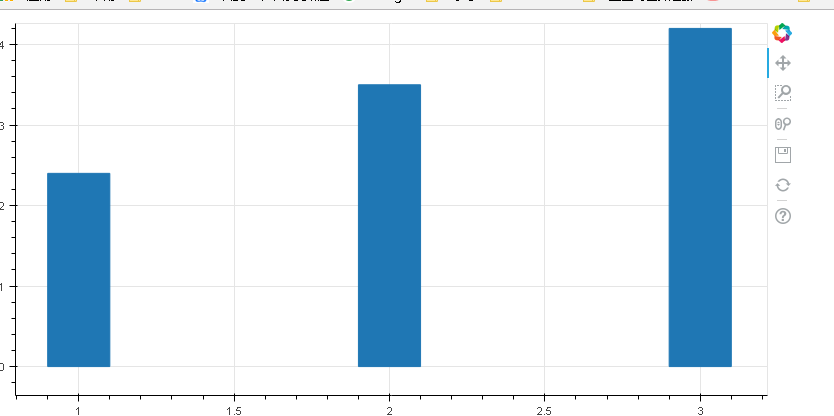
bar
from bokeh.plotting import figure, show
import numpy as np
p=figure(plot_width=800,plot_height=400)
p.vbar(x=[1,2,3],top=[2.4,3.5,4.2],width=0.2)
show(p)
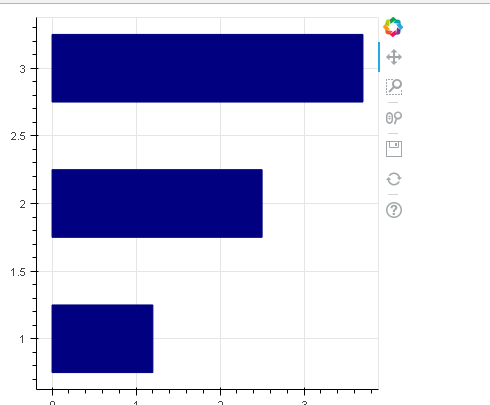
from bokeh.plotting import figure, show
p = figure(plot_width=400, plot_height=400)
p.hbar(y=[1, 2, 3], height=0.5, left=0,
right=[1.2, 2.5, 3.7], color="navy")
show(p)
3) image
from bokeh.plotting import figure, show
#url="""C:\\Users\\Administrator\\Pictures\\cat1.jpg"""
url1="""https://b-ssl.duitang.com/uploads/item/201604/15/20160415073709_d2XYs.jpeg"""
url2="""https://b-ssl.duitang.com/uploads/item/201601/19/20160119143747_i84Nx.png"""
url3="""https://b-ssl.duitang.com/uploads/item/201408/12/20140812131500_GTvHZ.jpeg"""
p=figure(x_range=(0,100),y_range=(0,100),plot_width=800,plot_height=800)
p.image_url(url=[url1,url3],x=(0,50),y=(100,50),w=50,h=50)
p.xaxis.visible=None
p.yaxis.visible=None
p.toolbar.logo=None
p.toolbar_location=None
show(p)
p.image_url(x,y的每一项对应相应图片的左上角坐标
如果图片为本地路径,也是支持的。