

R语言画点状误差线
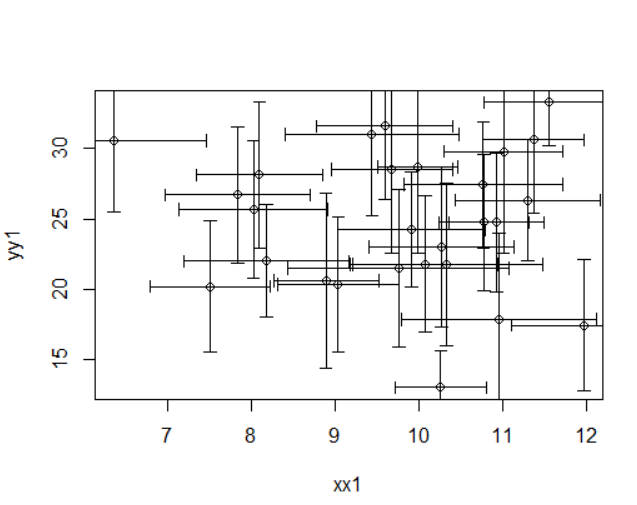
现在项目需要R语言做几个线性拟合,画一些点图,突然需要画误差线,网上找了下,可以用代码实现。。效果如下
xx1<-c(xxxxxx,xxxx,xxxxx)
yy1<-c(xxxxxx,xxxx,xxxxx)
std1<-c(xxxxxx,xxxx,xxxxx)
std2<-c(xxxxxx,xxxx,xxxxx)
plot_stdy <- function(x, y, sd, len = 1, col = "black") {
len <- len * 0.05
arrows(x0 = x, y0 = y, x1 = x, y1 = y - sd, col = col, angle = 90, length = len)
arrows(x0 = x, y0 = y, x1 = x, y1 = y + sd, col = col, angle = 90, length = len)
}
plot_stdx <- function(x, y, sd, len = 1, col = "black") {
len <- len * 0.05
arrows(x0 = x, y0 = y, x1 = x-sd, y1 =y , col = col, angle = 90,length = len)
arrows(x0 = x, y0 = y, x1 = x+sd, y1 =y, col = col , angle = 90,length = len)
}
plot(xx1,yy1)
plot_stdy(xx1, yy1, sd = std2)
plot_stdx(xx1, yy1, sd = std1)
