
[转帖]Tutorial : Thematic mapping with the Google Maps Flash API
Tutorial : Thematic mapping with the Google Maps Flash API
Google has recently released a Flash version of the Google Maps API. The goal is to give developers and designers more freedom in the presentation and graphical effects of their maps. Google is certainly not the first provider of a Flash mapping API (see the Yahoo! Maps AS3 API for example) but as one of the original proponents of Ajax web mapping tools, it marks an interesting change of direction (although the original Google Maps API is probably not going away anytime soon). One interesting aspect of using Flash is also a boost in vector graphics rendering speed, which I am going to demonstrate here, with a tutorial showing how to display a chloropleth map with this new API. Here is a link to the final application. It has to be noted that I am definitely not a Flex/ActionScript guru (just a few evenings of experience) so there are probably better ways of doing things than what I am showing here.
Getting the data
The data used is the simplified world borders shapefile found on Thematic Mapping (ie the TM_WORLD_BORDERS_SIMPL-0.2.zip file, at the bottom of the page). I have tried with the non simplified world borders as well, it is usable and quite fast to display but still feels somewhat sluggish, so the simplified dataset it is.
The application
The first step is to create the the MXML, with the component holding the map on it :

Probably not earth-shattering… The ThematicMapContainer class in the com.vellut.examples.gmapsflash package is a subclass of UIComponent. Here is the beginning of this class, that is going to be enriched as the tutorial progresses :


 public

 }
} }
}In the constructor, we subscribe to the “initialize” event of the container to start creating the map. Then when the initialiization is complete, the map is created and added to the container. Note that the API key is passed through the HTML page embedding the application (using flashVars), so this is why it does not appear anywhere here. The interesting thing, as far as the Google Maps Flash API is concerned, happens in the “onMapReady” method, called when the map has finished loading. Controls and various behaviours are added. The “createAndAddGeometries” method is also called: It is going to create the polygons for all the countries in the world, compute a color for each of them (according to an attribute of the country) and place them on the map. Note that contrary to what could be done with the Google Maps AJAX API, there is currently no way to place geometries through a KML or GeoRSS link. This means the polygons must be manually created though more atomic API calls.
Creating the polygons
There are 2 ways to create a polygon : point by point (with LatLng objects) or using an array of EncodedPolylineData objects, which is more compact. The second method also lets us have levels of detail for the polygons, which means some points will not be displayed when the map is zoomed out, which is quite useful when we have a heavy layer, so for this tutorial I chose the second method. One problem with the current version of the API is that the second method does not seem to work (the issue has been reported on the gmaps-api-issues tracker: there is a complaint of a missing attribute on the EncodedPolylineData object ; encoded polylines work fine). Still there is a very easy workaround. Create this class :
It can be used subsequently everytime the original EncodedPolylineData class is expected. Now that this is over with, on to more interesting things.
In the following body of the “createAndAddGeometries” method, the polygons are created, added to the map and the call to the method attributing a color class to each geometry is made :
The complete set of polygons is generated offline through a Python script, which uses the Shapely and Gpolyenc libraries. The former takes care of reading the world borders Shapefile (through its OGR binding), while the latter encodes each polyline into the Google polyline encoding format and performs some cartographic generalization through the Douglas-Peucker algorithm (which will let us drop some points while zoomed out). The output of the script is a text file containing valid ActionScript code that can be copy-pasted into the “createAndAddGeometries” method body and compiled with the rest of the code. The script is packaged along with the Flex/ActionScript code for this tutorial (the 2 libraries mentioned above and the dataset will have to be downloaded separately though).
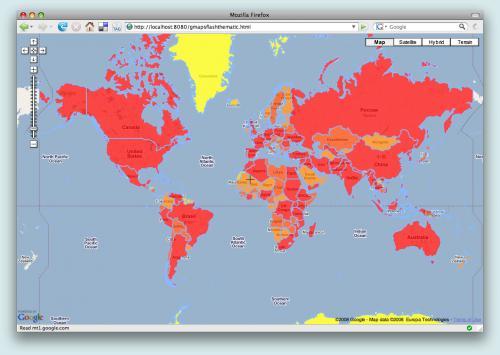
Each country feature gets a geometry, along with 2 attributes: Area and Population in 2005. The thematic analysis will be performed on the population (”pop2005″, in the call to the chloropleth method). We want 5 classes (each class will have the same number of countries). Finally, the countries with the lowest population will be in yellow, while the ones with the largest will be in red.
Computing the classes
The “chloropleth” method is as follows:
There are 3 steps in the process :
- Sorting the countries in order of their population value.
- Obtaining the intermediate colors, between yellow and red. An interpolation on the values of the RGB components is performed. We get a color value for each class.
- Finally, associating each country with a class, according to their population value. The breaks are performed at each quantile according to the “numClasses” parameter (in our case, quintile). The color is associated to the polygon by setting the “fillStyle” option of the PolygonOptions object. We keep the polygons somewhat transparent (70% opaque) so we can still see the ground.
And this is it! After a very short time, the polygons are all displayed.
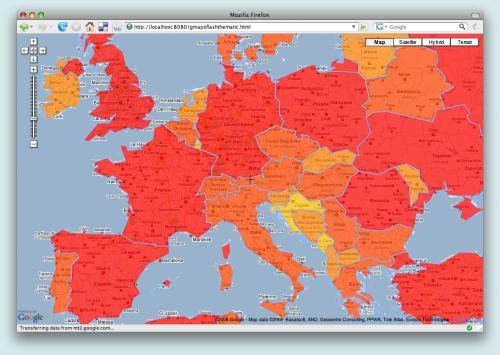
Now about the speed: It has to be said it is pretty fast. Check for yourself. As a comparison, here is the same dataset, displayed on the AJAX API. Note that however, the method to add the polygons is not the same: The latter one uses the GGeoXml class to add a KML file. As noted above, this is not currently available on the Flash API.
The source code
Here is a link to an archive containing the code, with the Flex Builder 3 project, as well as the “createAs.py” python script.
