
echarts常用实例
1、柱状图:
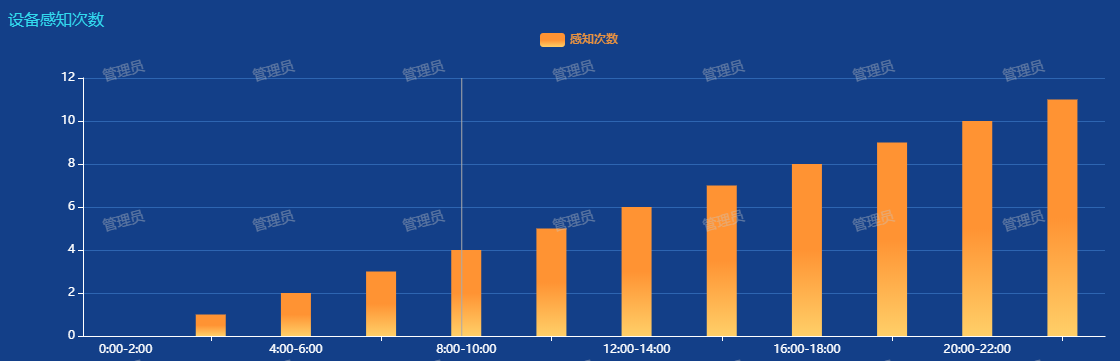
1、需要动态加载的参数是x轴以及柱状图的数值,legendData和seriesData。demo使用是可以直接写死参数,在执行this.initChart()方法即可。具体代码可以参数以下code.


<!--门禁卡开门统计-->
<template>
  <div class="openCardCountEle" style="height: 90%;width: 100%;padding: 4px;" v-loading="isLoading">
    <div style="width: 100%;height: 100%;z-index: 0">
      <div id="openCardCountEleID"></div>
    </div>
  </div>
</template>

<script>
  import echarts from 'echarts';
  import {getFileDetail30DaysTime} from 'api/viasadmin/arcgisMap/IntelDigCtrl';
  import {openCardCount} from 'api/dashboard';
  export default {
    name: "openCardCountEle",
    props:['curDAItem'],
    data() {
      return {
        chart: null,
        id: 'openCardCountEleID',
        isLoading: false,
        color: [
          '#ff8463','#9bca62','#2ec7c9','#b6a2de','#5ab1ef',
          '#8d98b3','#e5cf0d','#97b552','#95706d','#dc69aa',
          '#07a2a4','#9a7fd1','#588dd5','#f5994e','#c05050',
          '#59678c','#c9ab00','#7eb00a','#6f5553','#c14089'
        ],
        legendData: ['0:00-2:00', '2:00-4:00', '4:00-6:00', '6:00-8:00', '8:00-10:00', '10:00-12:00',
          '12:00-14:00','14:00-16:00','16:00-18:00','18:00-20:00','20:00-22:00','22:00-24:00'],
        seriesData:[],
        // seriesData:[10, 52, 200, 334, 390, 330, 220],
      };
    },
    beforeDestroy() {
      if (!this.chart) {return false;}
      this.chart.dispose();
      this.chart = null;
    },
    beforeCreate(){},
    created(){},
    mounted() {
      this.$nextTick(() => {
        this.getList();
        // this.initChart();
      });
    },
    methods: {
      getList(){
         //获取上次的勾选记录
        this.isLoading = true;
        const param ={
          archivesCode:this.curDAItem.archivesCode,
          topNum:10
        }
        getFileDetail30DaysTime(param).then(rsp=>{
          this.isLoading = false;
          if(rsp.status == 200 && rsp.data){
           this.seriesData = rsp.data;
          } else {
            this.seriesData =[];
          }
          this.initChart();
        })
      },
      initChart() {
        $("#openCardCountEleID").width($(".openCardCountEle").width());
        $("#openCardCountEleID").height($(".openCardCountEle").height());
        this.chart = echarts.init(document.getElementById(this.id));
        this.chart.setOption({
          color: this.color,
          grid: {
            left: '80px',
            right: '50px',
            top: '70px',
            bottom:'30px',

          },
          legend: {
            data: ['感知次数'],
            top: 20,
            textStyle:{color:'#E69142', fontWeight:'bold'},
          },
          title: {
            text: '设备感知次数',
            textStyle:{
              fontSize: 16,
              fontWeight: "normal",
              color: "#32DBEF"
            }
          },
          tooltip: {
            trigger: 'axis',
            showDelay:200,
          },
          xAxis: {
            type: 'category',
            data: this.legendData,
            axisLine: {
              lineStyle: {
                color: '#fff',
                width: 1,//这里是为了突出显示加上的
              },
            },
            splitLine: {
              show: false,
              lineStyle:{color: ['#2E65B1'], width: 1, type: 'solid'}
            }
          },
          yAxis : [{
              axisLine: {lineStyle: {color: '#fff', width: 1}},
              type : 'value',
              splitLine: {show: true, lineStyle:{color: ['#2E65B1'], width: 1, type: 'solid'}},
              axisLabel: {show: true, textStyle: {color: '#fff'}}
            }],
          series : [
            {
              name:'感知次数',
              type:'bar',
              data:this.seriesData,
              barMaxWidth: '30',
              itemStyle: {
                normal: {
                  color: new echarts.graphic.LinearGradient(0, 1, 0, 0, [{
                    offset: 0,
                    color: "#FFCF68" // 0% 处的颜色
                  },{
                    offset: 0.5,
                    color: "#ff9333" // 100% 处的颜色
                  }, {
                    offset: 1,
                    color: "#ff9333" // 100% 处的颜色
                  }], false)
                }
              }
            }
          ]
        },true);

      }
    }
  }
</script>

<style scoped></style>
2、折现图。折线过多,legend需要支持分页。
数据接口格式:
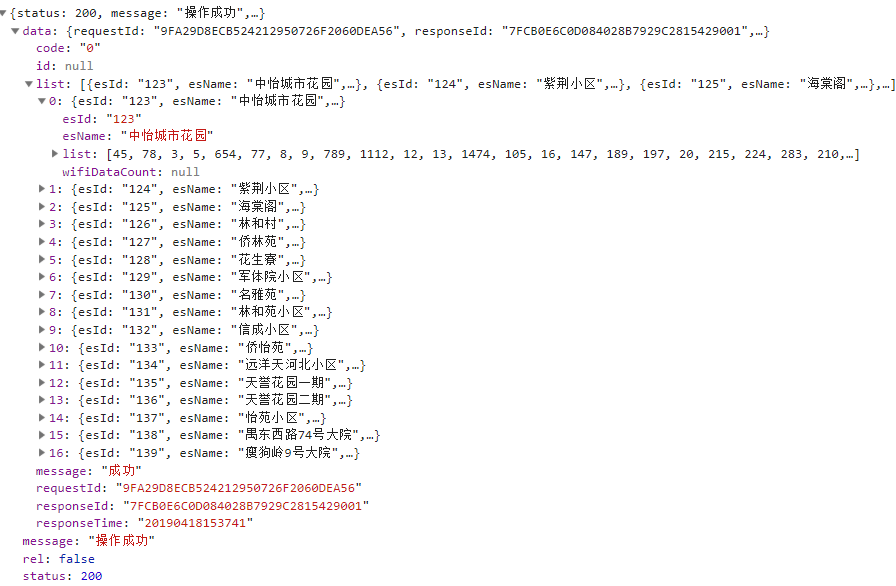
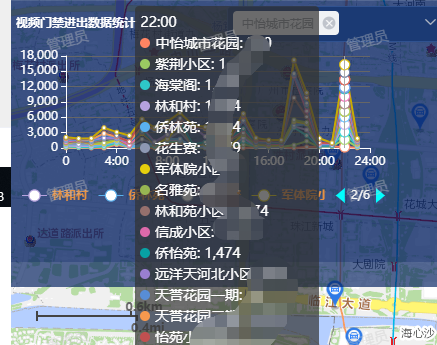
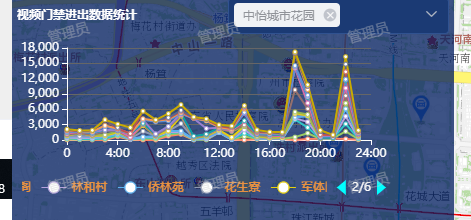
<!--视频门禁-->
<template>
  <div class="videoDoorCtrl" v-loading="isLoading">
    <div class="videoDoorTitle">
      <span class="title">视频门禁进出数据统计</span>
      <span class="mapSelectBox">
        <el-select class="selectCls" v-model="regionTypeVal"  multiple collapse-tags @change="outInTypeChange">
         <el-option v-for="item in AreaOptionList" :key="item.value" :label="item.label" :value="item.value"> </el-option>
        </el-select>
      </span>
    </div>
    <div style="width: 100%;height: 100%;z-index: 0">
      <div :class="className" id="videoDoorID"></div>
    </div>
  </div>
</template>

<script>
  import echarts from 'echarts';
  import {doorCount} from 'api/viasadmin/arcgisMap/arcgisMap';
  import {residentialAreaDoorList} from '../../../api/com';

  export default {
    name: "videoDoorCtrl",
    props: {
      className: { type: String, default: 'chart'},
      id:        { type: String, default: 'videoDoorID' },
    },
    data() {
      return {
        chart: null,
        regionTypeVal:[],
        outInTypeOpt:[{value:'1',label:'出门'},{value:'2',label:'入门'}],
        isLoading:false,
        color:[
          '#ff8463','#9bca62','#2ec7c9','#b6a2de','#5ab1ef',
          '#8d98b3','#e5cf0d','#97b552','#95706d','#dc69aa',
          '#07a2a4','#9a7fd1','#588dd5','#f5994e','#c05050',
          '#59678c','#c9ab00','#7eb00a','#6f5553','#c14089'
        ],
        legendData:[],
        seriesData:[],
        selected:{},
        AreaOptionList:[],
        param : {
          esList:[],    // 空的话默认查询全部
          startDate:'', // 默认当天
          endDate:''
        }
      };
    },
    beforeDestroy() {
      if (!this.chart) {return false;}
      this.chart.dispose();
      this.chart = null;
    },
    beforeCreate(){},
    created(){
      this.getAreaList();
    },
    methods: {
      getAreaList(){
        const paramList = {};
        let getLastSet=[];
        if(window.localStorage.getItem("mapHomeVideoDoorSelectList")){
          getLastSet = JSON.parse(window.localStorage.getItem("mapHomeVideoDoorSelectList"));
        }

        //获取上次的勾选记录
        this.isLoading = true;
        residentialAreaDoorList(paramList).then(rsp =>{
          this.isLoading = false;
          if(rsp.status == 200){
            for(let i = 0;i<rsp.result.length;i++){
              this.AreaOptionList.push({'value': rsp.result[i].value, 'label': rsp.result[i].label});
            }
            if(getLastSet){
              for(let i =0;i<getLastSet.length;i++){
                this.regionTypeVal.push(getLastSet[i].id);
                this.param.esList.push({id:getLastSet[i].id})
              }
            }
          } else {
            this.AreaOptionList = [];
          }
          this.getChartData();
        })
      },
      getChartData(){
        doorCount(this.param).then(rsp => {
          this.legendData = [];
          this.seriesData= [];
          this.selected= [];
          if (rsp.status == 200) {
            for (let i = 0; i < rsp.data.list.length; i++) {
              this.legendData.push(rsp.data.list[i].esName);
              this.seriesData.push({
                name: rsp.data.list[i].esName,
                type: 'line',
                stack: '总量',
                data: rsp.data.list[i].list
              })
              this.selected[rsp.data.list[i].esName] = i;
            }
          } else{
            this.seriesData = [];
            this.legendData = [];
            this.selected = {};
          }
          this.initChart();
        })
      },
      initChart() {
        // $("#videoDoorID").width($(".videoDoorCtrl").width());
        // $("#videoDoorID").height($(".videoDoorCtrl").height());
        $("#videoDoorID").width($(window).width() * 0.20); // 和首页的initPage方法进行对应。
        $("#videoDoorID").height(($(window).height()-80)*0.25);

        this.chart = echarts.init(document.getElementById(this.id));
        this.chart.setOption({
          color: this.color,
          grid: {
            left: '50px',
            right: '30px',
            top: '50px',
            bottom:'80px'
          },
          legend: {
            type: 'scroll',
            orient: 'horizontal',//vertical
            right: 10,
            bottom: 20,
            data: this.legendData,
            textStyle:{
              color:'#E69142',
              fontWeight:'bold'
            },
            pageTextStyle:{ //图例页信息的文字样式。
              color:'#fff'
            },
            animation:true,
            selected: this.selected,
            pageIconColor: '#00FFFF', //翻页按钮的颜色。
            pageIconInactiveColor:'#ADE5E5',  // 翻页按钮不激活时(即翻页到头时)的颜色
          },
          tooltip: {
            trigger: 'axis',
            axisPointer: {
              type: 'line'
            },
            showDelay:200,
            confine :true,  //是否将 tooltip 框限制在图表的区域内
        },
          xAxis: {
            type: 'category',
            boundaryGap: false,
            data: ['0','1:00','2:00','3:00','4:00','5:00','6:00','7:00','8:00','9:00','10:00','11:00','12:00', '13:00',
              '14:00','15:00','16:00','17:00','18:00','19:00','20:00','21:00','22:00','23:00','24:00'],
            axisLine: {
              lineStyle: {
                color: '#fff',
                width: 1,//这里是为了突出显示加上的
              }
            },
            splitLine: {
              show: false,
              lineStyle:{color: ['#666'], width: 1, type: 'solid'}
            }
          },
          yAxis: {
            type: 'value',
            axisLine: {lineStyle: {color: '#fff', width: 1}},
            splitLine: {
              show: true,
              lineStyle:{color: ['#666'], width: 1, type: 'solid'}
            },
            axisLabel: {show: true, textStyle: {color: '#fff'}
            }
          },
          series: this.seriesData
        },true);

      },
      outInTypeChange(val){
        this.regionTypeVal = val;
        this.param.esList = [];
        for(let i = 0;i<this.regionTypeVal.length;i++){
          this.param.esList.push({id:this.regionTypeVal[i]});

        }
        // 把勾选的结果保存到localstroage
        window.localStorage.setItem("mapHomeVideoDoorSelectList",JSON.stringify(this.param.esList));
        this.getChartData();
      }
    }
  }
</script>

<style scoped>
  .videoDoorCtrl {
    color: #333;
    padding: 5px;
    width: 100%;
    height: 100%;
    position: relative;
  }
  .videoDoorTitle {
    position: absolute;
    top: 5px;
    z-index: 9;
    width: 100%;
  }
  .selectCls {
    width: 50%;
    border-radius: 6px;
    float: right;
    margin-right: 10px;
  }
  .videoDoorTitle .title{
    color: #ffffff;
    font-weight: 600;
    /*font-size: 15px;*/
    font-size: 0.18rem;
    margin-top: 8px;
    display: inline-block;
  }

</style>
3、饼状图。
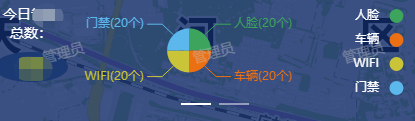
此处是2个冰柱图进行轮播,没有截图出图二。
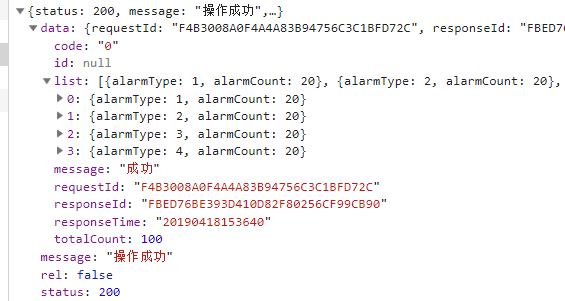
数据格式如下:
  1 <!--辖区基础数据-->
  2 <template>
  3   <div style="margin: 2%;height: 100%;width: 100%;" class="communityPolice">
  4     <el-carousel height="100%" :autoplay=false :interval = 1000*30>
  5       <el-carousel-item>
  6         <el-col :span="4">
  7           <span style="display: inline-block;text-align: center;width: 100%;">今日告警<br/>总数:</span>
  8           <span class="totalCls">
  9             {{policeData.totalCount}}
 10           </span>
 11         </el-col>
 12         <el-col :span="20">
 13           <div class="chartsOutter" style="width: 98%;height: 100%;">
 14             <div id="policID" style="width: 100%;"></div>
 15           </div>
 16         </el-col>
 17       </el-carousel-item>
 18       <el-carousel-item>
 19         <el-col :span="4">
 20           <span style="display: inline-block;text-align: center;width: 100%;">警情总数:</span>
 21           <span class="totalCls">
 22               {{warnDetilData.totalCount}}
 23             </span>
 24         </el-col>
 25         <el-col :span="20">
 26           <div class="chartsOutter" style="width: 98%;height: 100%;">
 27             <div id="warnDetilID" style="width: 100%;"></div>
 28           </div>
 29         </el-col>
 30       </el-carousel-item>
 31     </el-carousel>
 32    </div>
 33 </template>
 34
 35 <script>
 36   import {communityCount,communityXQCount,communityXQWarnCount} from 'api/viasadmin/arcgisMap/arcgisMap';
 37   import {filterFieldFun,curTimeFun} from 'filters/index';
 38   import { mapGetters } from 'vuex';
 39   import echarts from 'echarts';
 40
 41   export default {
 42     name: "communityPolice",
 43     data() {
 44       return {
 45         esListParam:[],
 46         color:[
 47           '#3CA45C','#EB6F13','#C9C438','#5BB7EC','#D882C3',
 48           '#8d98b3','#e5cf0d','#97b552','#95706d','#dc69aa',
 49           '#07a2a4','#9a7fd1','#588dd5','#f5994e','#c05050',
 50           '#59678c','#c9ab00','#7eb00a','#6f5553','#c14089'
 51         ],
 52         listQueryWarn:{
 53           startTime:'',
 54           endTime:'',
 55           esList:[]
 56         },
 57         warnDetilData:{
 58           totalCount:'',
 59           seriesData:[],
 60           legendData:[],
 61         },
 62         listQueryPolice:{
 63           endDate:'',
 64           startDate:'',
 65           esList:[]
 66         },
 67         policeData:{
 68           totalCount:'',
 69           seriesData:[],
 70           legendData:[],
 71         }
 72       }
 73     },
 74     computed: {
 75       ...mapGetters([ 'mapGlobalCommunityIDGetter'])
 76     },
 77     watch: {
 78       // 监听所选社区数据变化
 79       mapGlobalCommunityIDGetter(val) {
 80         this.listQueryPolice.esList = val;
 81         this.getPoliceChartData();
 82       },
 83     },
 84     created() {
 85       let timeTodayStart = curTimeFun('1','-')+' 00:00:00';
 86       let timeTodayEnd = curTimeFun('1','-')+' 23:59:59';
 87       this.listQueryPolice.startDate = timeTodayStart;
 88       this.listQueryPolice.endDate = timeTodayEnd;
 89       this.listQueryWarn.startTime = timeTodayStart;
 90       this.listQueryWarn.endTime = timeTodayEnd;
 91     },
 92     mounted() {
 93       this.$nextTick(() => {
 94         this.listQueryPolice.esList = this.$store.getters.mapGlobalCommunityIDGetter;
 95         this.getPoliceChartData();
 96         this.getWarnDetilChartData();
 97       });
 98     },
 99     methods: {
100       getWarnDetilChartData(){  // 警情总数
101         communityXQWarnCount(this.listQueryWarn).then(rsp=>{
102           if(rsp.status == 200){
103             let total= 0;
104             this.warnDetilData.legendData = [];
105             this.warnDetilData.seriesData = [];
106             for(let i = 0;i<rsp.data.length;i++){
107               total +=rsp.data[i].policeCaseNum;
108               this.warnDetilData.legendData.push(rsp.data[i].policeCaseType);
109               this.warnDetilData.seriesData.push({
110                 value:rsp.data[i].policeCaseNum,
111                 name:rsp.data[i].policeCaseType
112               })
113             }
114             this.warnDetilData.totalCount = total;
115             this.initWainDetilChart();
116           }
117         })
118       },
119       initWainDetilChart() {  // 警情总数
120         $("#warnDetilID").width($(window).width() * 0.20*0.9); // 和首页的initPage方法进行对应。
121         $("#warnDetilID").height(($(window).height()-80)*0.13);
122         this.chart = echarts.init(document.getElementById("warnDetilID"));
123         this.chart.setOption({
124           color: this.color,
125           tooltip : {trigger: 'item', formatter: "{a} <br/>{b} : {c} ({d}%)"},
126           grid: {top: '0px', bottom:'80px', right:'10px'},
127           legend: {
128             orient: 'vertical',
129             type: 'scroll',
130             left: 'right',
131             icon:'circle',
132             right: 30,
133             pageTextStyle:{color:'#fff'}, //图例页信息的文字样式。
134             textStyle:{color:'#fff',},
135             animation:true,
136             data: this.warnDetilData.legendData,
137             selected: this.policeData.legendData,
138             pageIconColor: '#00FFFF', //翻页按钮的颜色。
139             pageIconInactiveColor:'#ADE5E5',  // 翻页按钮不激活时(即翻页到头时)的颜色
140           },
141           series : [{
142             name: '警情总数',
143             type: 'pie',
144             radius : '38%',
145             center: ['35%', '40%'],
146             data: this.warnDetilData.seriesData,
147             itemStyle: {emphasis: {shadowBlur: 10, shadowOffsetX: 0, shadowColor: 'rgba(0, 0, 0, 0.5)'}},
148             label:{
149               normal:{
150                 formatter: "{b}({c}个)"
151               }
152             }
153           }]
154         },true);
155       },
156       getPoliceChartData(){ // 警情告警
157         communityXQCount(this.listQueryPolice).then(rsp=>{
158           if(rsp.status == 200){
159             this.policeData.totalCount = rsp.data.totalCount;
160             this.policeData.legendData = [];
161             this.policeData.seriesData = [];
162             for(let i = 0;i<rsp.data.list.length;i++){
163               this.policeData.legendData.push(filterFieldFun(rsp.data.list[i].alarmType,'alarmTypeGetter'));
164               this.policeData.seriesData.push({
165                 value:rsp.data.list[i].alarmCount,
166                 name:filterFieldFun(rsp.data.list[i].alarmType,'alarmTypeGetter')
167               })
168             }
169             this.initPolicChart();
170           }
171         })
172       },
173       initPolicChart() {  // 今日告警
174
175         $("#policID").width($(window).width() * 0.20*0.9); // 和首页的initPage方法进行对应。
176         $("#policID").height(($(window).height()-80)*0.13);
177         this.chart = echarts.init(document.getElementById("policID"));
178         this.chart.setOption({
179           color: this.color,
180           tooltip : {trigger: 'item', formatter: "{a} <br/>{b} : {c} ({d}%)"},
181           grid: {top: '0px', bottom:'80px', right:'10px'},
182           legend: {
183             type: 'scroll',
184             orient: 'vertical',
185             icon:'circle',
186             left: 'right',
187             right: 30,
188             pageTextStyle:{color:'#fff'}, //图例页信息的文字样式。
189             textStyle:{color:'#fff',},
190             animation:true,
191             data: this.policeData.legendData,
192             selected: this.policeData.legendData,
193             pageIconColor: '#00FFFF', //翻页按钮的颜色。
194             pageIconInactiveColor:'#ADE5E5',  // 翻页按钮不激活时(即翻页到头时)的颜色
195           },
196           series : [{
197             name: '今日告警总数',
198             type: 'pie',
199             radius : '38%',
200             center: ['35%', '40%'],
201             data: this.policeData.seriesData,
202             itemStyle: {emphasis: {shadowBlur: 10, shadowOffsetX: 0, shadowColor: 'rgba(0, 0, 0, 0.5)'}},
203             label:{
204               normal:{
205                 formatter: "{b}({c}个)"
206               }
207             }
208           }]
209         },true);
210       },
211     },
212   }
213 </script>
214
215 <style rel="stylesheet/scss" lang="scss" scoped>
216   .el-col {
217     height: 100%;
218   }
219   .communityPolice td {
220     padding: 8px;
221   }
222   .communityPolice .tdnum {
223     color: #ff9333;
224     font-weight: 600
225   }
226   .communityPolice .totalCls {
227     display: inline-block;
228     text-align: center;
229     width: 100%;
230     font-size: 16px;
231     font-weight: 600;
232     background: #1b3a74;
233     border-radius: 100%;
234     height: 30px;
235     color: yellow;
236     line-height: 30px;
237     margin-top: 10px;
238   }
239 </style>
