
R语言学习-第一课
R语言基本语法
赋值:R语言中采用等号(=)或者箭头(<-)进行赋值操作
    a <- "hello, world"
    或
    a = "hello, world"
注释:R语言采用#开头填写注释
#此处为注释
数据类型
向量:vectors
-当你想用多个元素创建向量的时候,你应该使用c()函数,这意味着将元素组合成一个向量
-向量是以一维数组的方法管理数据的一种对象类型
-向量里的元素可以是数值型、字符型和逻辑型
    a <- c(1, 2, 5, 3, 6, -2, 4)# 一个数字向量
    b <- c("one", "two", "three")# 一个字符型向量
    c <- c(TRUE, TRUE, TRUE, FALSE, TRUE, FALSE)# 一个逻辑型向量
    mode(a)#查看变量a中元素的类型
    print(a)#输出变量a
    mode(b)
    print(b)
    mode(c)
    print(c)
    # Using vector subscripts with brackets
    #r语言下标从1开始
    a[3]#查看向量a中下标为3的元素
    a[c(1, 3, 5)]#查看向量a中下标为向量(1,3,5)的元素
    a[2:6]#查看向量a中下标为2到6的元素
矩阵:matri
-矩阵是二位数据集,他可以使用函数的向量输入创建
    matrix(data = NA,nrow = 1,ncol = 1,byrow = FALSE,dimnames = NULL)#一个一般的矩阵
    y=matrix(1:20, nrow = 5, ncol = 4)#用1到20创建一个矩阵,5行,4列
    y
-另外的例子
    cells=c(1, 26, 24, 68)
    rnames=c("R1", "R2")
    cnames=c("C1", "C2")
    mymatrix=matrix(cells, nrow = 2, ncol = 2, byrow = TRUE,dimnames = list(rnames, cnames))
    #by row
    mymatrix
    mymatrix=matrix(cells, nrow = 2, ncol = 2, byrow = FALSE,  dimnames = list(rnames, cnames))
    #by colume
    mymatrix
-如果只指定了行数,没有指定列数,matrix会自动根据元素的数量进行分配
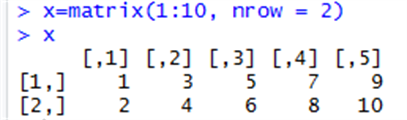
-注意:在R语言中,1:10,产生的数列包括10,在其他语言中,只包括左端,不包括右端
    x=matrix(1:10, nrow = 2)
    x
-查看矩阵指定位置的元素
-语法:矩阵变量名[行标,列标]
-查看矩阵第二行元素
x[2, ]#select the 2nd row
-查看矩阵第二列元素
x[, 2]
-查看元素第1行,第4列元素
x[1, 4]#select the 1st row,4th column element
-查看元素第1行第4列和第5列元素
x[1, c(4, 5)]
数组:arrays
-下面我们创建一个包含4个元素的数组,每个元素为2x3个矩阵
    dim1=c("A1", "A2")
    dim2=c("B1", "B2", "B3")
    dim3=c("C1", "C2", "C3", "C4")
    z=array(1:24, c(2, 3, 4), dimnames = list(dim1,dim2,dim3))
    z
因子:factors
-如何理解R中因子(factor)的概念?
-因子是使用向量创建的r对象,它将向量与向量中的元素的不同值一起存储为标签。标签总是字符,不管他在输入向量中是数字还是字符或者是布尔值等。他们在统计建模中围场游泳。
-使用factor()函数创建因子,nlevels函数给出级别计数。
apple_colors <- c('green','green','yellow','red','red','red','green')
factor_apple <- factor(apple_colors)
print(factor_apple)
print(nlevels(factor_apple))

diabetes=c("Type1","Type2","Type1","Type1")
status=c("Poor", "Improved", "Excellent", "Poor")
diabetes[3]
status[1]
## specify the vectors as factors ##
diabetes=factor(diabetes)
status=factor(status, order = TRUE)
diabetes[3]
status[1]
##Using factors ##
#Step1:enter the variables as vectors
patientID=c(1, 2, 3, 4)
age=c(25, 34, 28, 52)
diabetes=c("Type1", "Type2", "Type1", "Type1")
status=c("Poor", "Improved", "Excellent", "Poor")
#Step2:specify the vectors as factors #
diabetes=factor(diabetes)
status=factor(status, order = TRUE)
#Step3:create the dataframe#
patientdata=data.frame(patientID, age, diabetes, status)
#Step4: view the structure of the dataframe #
str(patientdata)
#Step5:get summary statistics on the variables#
summary(patientdata)#summary function treats the variables differently.
#using parameter"level=c()"to set the order
status2=c("Poor","Improved","Excellent", "Poor")
status2=factor(status2, order = TRUE,level=c("Poor","Improved", "Excellent"))
status2[1]
数据帧:data frames
-数据帧是表格数据对象。与数据帧中的矩阵不同,每列可以包含不同的数据模式。第一列可以是数字,而第二列可以使字符,第三列可以是逻辑的。他是等长度的向量的列表。
-使用data.frame()函数创建数据帧
    patientID=c(1, 2, 3, 4)
    age=c(25, 34, 28, 52)
    diabetes=c("Type1", "Type2", "Type1", "Type1")
    status=c("Poor", "Improved", "Excellent", "Poor")
    patientdata=data.frame(patientID, age, diabetes, status)
    patientdata
-列出数据帧的特定变量
-语法:数据帧变量名[行标,列标]
patientdata[,1:2]|#查看该数据帧的第一列到第二列
patientdata[c("diabetes", "status")]#查看该数据帧的"diabetes"和 "status"列
patientdata$age#查看该数据帧中标题为age的元素
patientdata[1,]#查看第一行的元素
-计算该数据帧中age一项的最大值最小值等等
summary(patientdata$age)
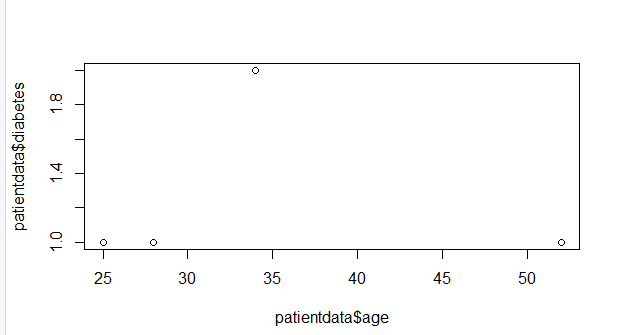
-画图
plot(patientdata$age,patientdata$diabetes)
列表:list
-列表是一个R对象,它可以在其中包含许多不同类型的元素,如向量,函数甚至其中另一个列表
-下面的例子中,列表mylist中包含四个元素,第一个是字符串,第二个是向量,第三个是矩阵,第四个是列表
g="My First List"
h=c(25, 26, 18, 39)
j=matrix(1:10, nrow = 5)
k=c("one", "two", "three")
mylist=list(title = g, ages = h, a = j, b = k)
mylist
mylist[[3]]
mylist["ages"]
mylist[[4]]
