一张图绘制多组散点图和折线图(R:ggplot2)
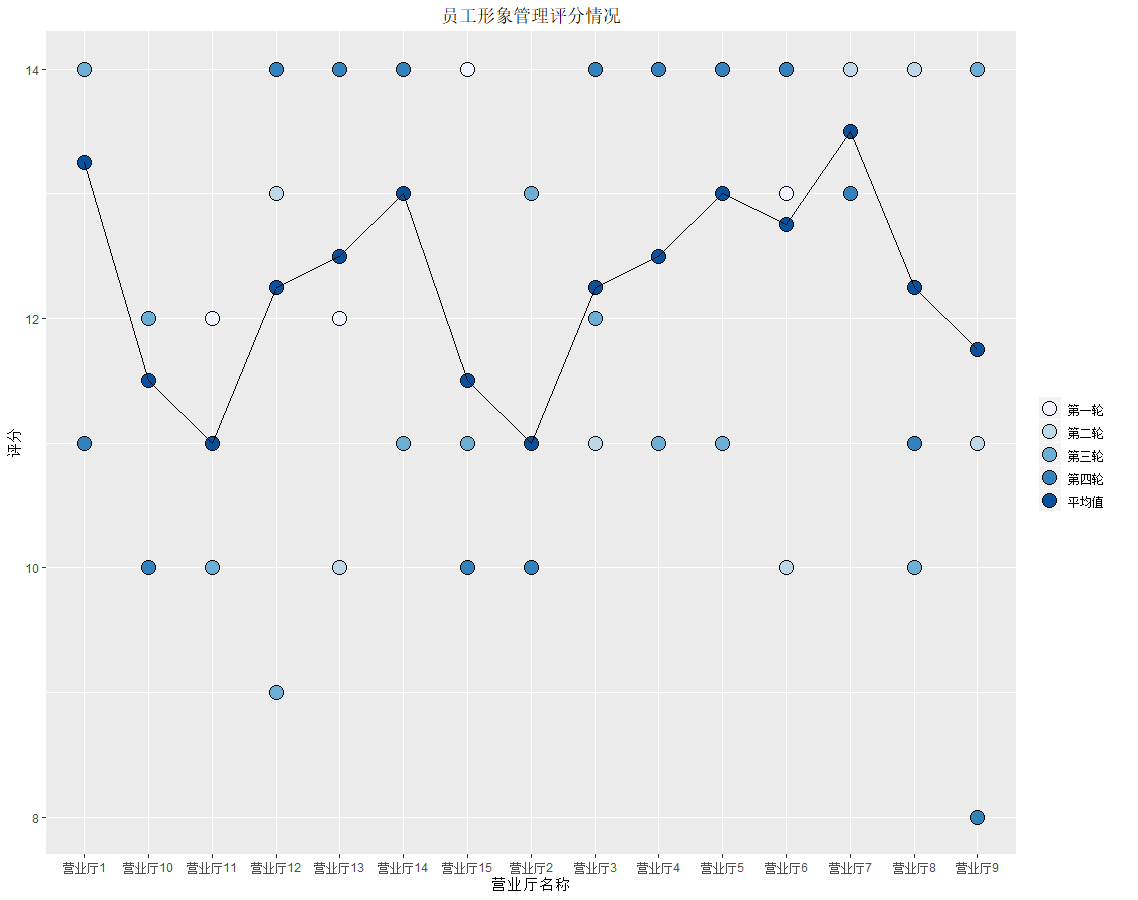
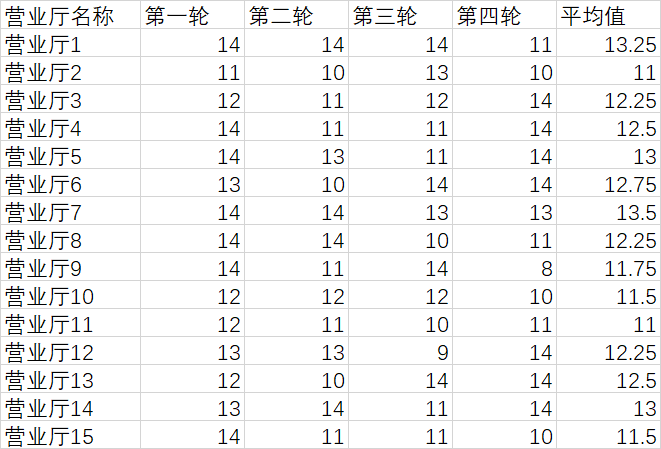
问题:如何在一张图上面绘制多组散点图和折线图?例如在下面的评分数据中,每轮数据绘制散点图,平均值绘制折线图。
数据(excel):营业厅评分数据
做法:R语言ggplot函数
library(readxl)
library(ggplot2)
data<-read_excel("C:\\...\\数据.xlsx",sheet = 2,col_names=T)
names(data)<-c("x","y1","y2","y3","y4","ym")
fills=c('第一轮'="blue",'第二轮'="yellow",'第三轮'="lightpink",'第四轮'="red",'平均值'="green")
ggplot(data)+geom_point(aes(x,y=y1,fill ="第一轮"),size=5,shape=21,color="black")+
    geom_point(aes(x,y=y2,fill="第二轮"),size=5,shape=21)+
    geom_point(aes(x,y=y3,fill="第三轮"),size=5,shape=21)+
    geom_point(aes(x,y=y4,fill="第四轮"),size=5,shape=21)+
    geom_point(aes(x,y=ym,fill="平均值"),size=5,shape=21)+
    geom_line(aes(x,y=ym),color="black",group=1)+labs(x="营业厅名称",y="评分",title="员工形象管理评分情况",fill="")+
    scale_fill_brewer(,limits=c('第一轮','第二轮','第三轮','第四轮','平均值'))+
    theme(plot.title = element_text(hjust = 0.5)) #采用默认配色
注:
- read_excel("C:\\...\\数据.xlsx",sheet = 2,col_names=T) #sheet指定第几个表,col_names=T 是将第一行设成列名。
- names(data)<-c("x","y1","y2","y3","y4","ym") #重命名列名,便于后面分开使用各列。
- fills=c('第一轮'="blue",'第二轮'="yellow",'第三轮'="lightpink",'第四轮'="red",'平均值'="green") #添加映射,便于后面图例按“第一轮”的形式输出。
- ggplot(data)+geom_point(aes(x,y=y1,fill ="第一轮"),size=5,shape=21,color="black") #填充参数fill是映射关系,放到aes函数里,shape=21 指定形状为实心圆点,color指定边框颜色。
- geom_line(aes(x,y=ym),color="black",group=1)+labs(x="营业厅名称",y="评分",title="员工形象管理评分情况",fill="") #geom_line添加折线,group=1 参数必须设定。labs设定行列标题及主标题,fill=“”指去掉图例标题。
- scale_fill_brewer(palette='Set1',limits=c('第一轮','第二轮','第三轮','第四轮','平均值')) #palette='Set1'设定颜色类型,空的话为默认色,limits 指定图例排列顺序。
- theme(plot.title = element_text(hjust = 0.5)) #plot.title = element_text(hjust = 0.5) #水平调整主标题文本位置到正中间,hjust = 0指靠左对齐。