prometheus+node_exporter+grafana搭建
鉴于近期正好在研究监控方面的工具,所以有了这篇搭建随笔。鉴于是随笔,所以有些地方没有详细解释,后期会慢慢补上,这里仅写了如何搭建。
一.前期规划和准备
1.软件安装规划
介于个人虚拟机只有2台,
故安排:
172.16.16.80
安排上 全部的exporter+prometheus+grafana
172.16.16.74
安装单机redis
和nginx
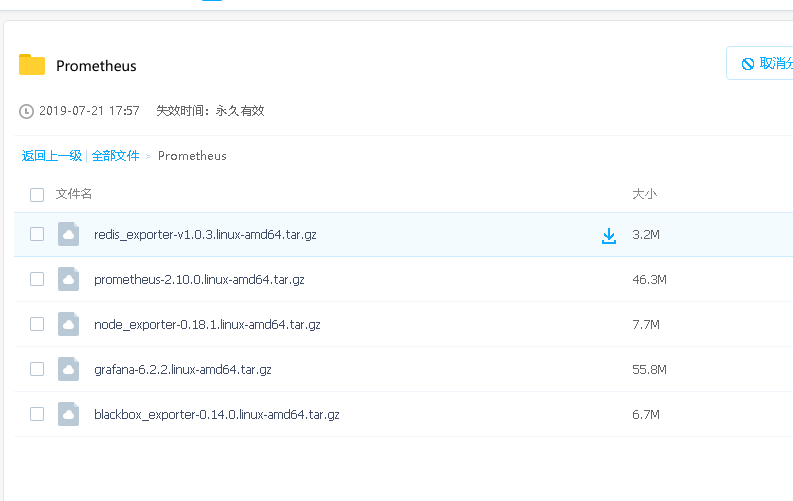
2.软件获取
链接: https://pan.baidu.com/s/1u1OjTQctdhZU3M-tqnckFQ 提取码: iy8n
里面包含了
prometheus,负责采集exporter指标和提供查询语句
node_exporter,监控主机性能比如内存,cpu等
redis_exporter,监控redis
black_box_exporter,提供icmp;get,post等模块检测页面
grafana --可视化展示
二.所需要达到的目标:
1.主机监控和展示
2.redis监控和展示
3.监控某一个页面,主机地址,Tcp连接和展示
三.node_exporter+prometheus+grafana搭建
prometheus
1.tar -xvf prometheus-2.10.0.linux-amd64.tar.gz
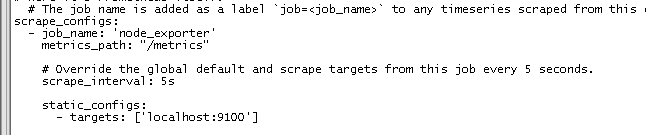
2.vi prometheus.yml
3.
这里要.yml文件注意格式问题。不然会报错,由于这是直接copy我自己的配置所以下面这个要注意格式问题
scrape_configs:
- job_name: 'node_exporter'
metrics_path: "/metrics"
# Override the global default and scrape targets from this job every 5 seconds.
scrape_interval: 5s
static_configs:
- targets: ['localhost:9100']
贴图:
4.nohup ./prometheus &
node_exporter
1.tar -xvf node_exporter-0.18.1.linux-amd64.tar.gz
2.nohup ./node_exporter &
3.tail -f nohup.out
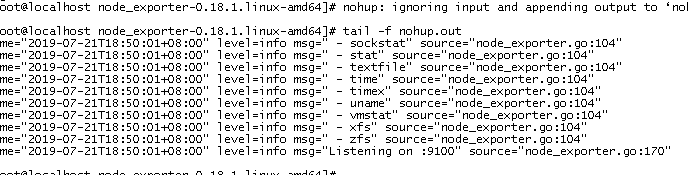
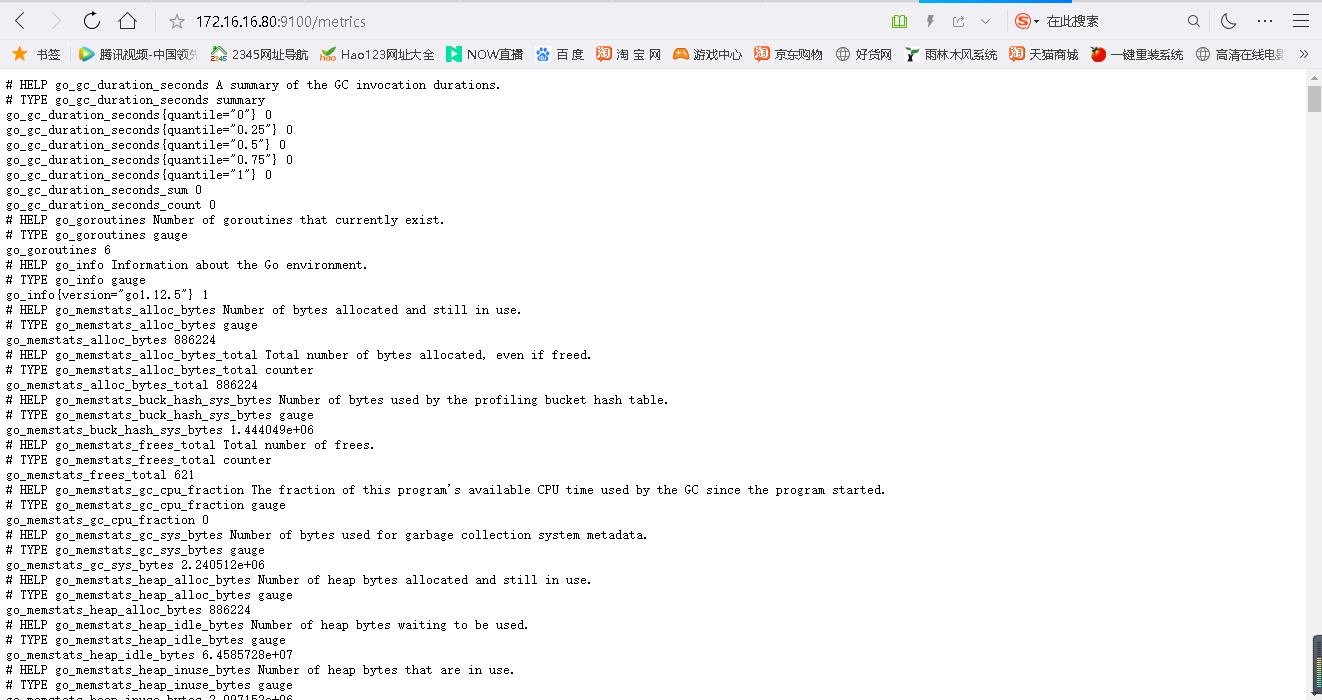
4.测试:curl http://172.16.16.80:9100/metrics
有返回就正常OK。或者浏览器带端口9100访问
5.http://172.16.16.80:9090/targets 进去查看exporter状态

这样就配置好了。
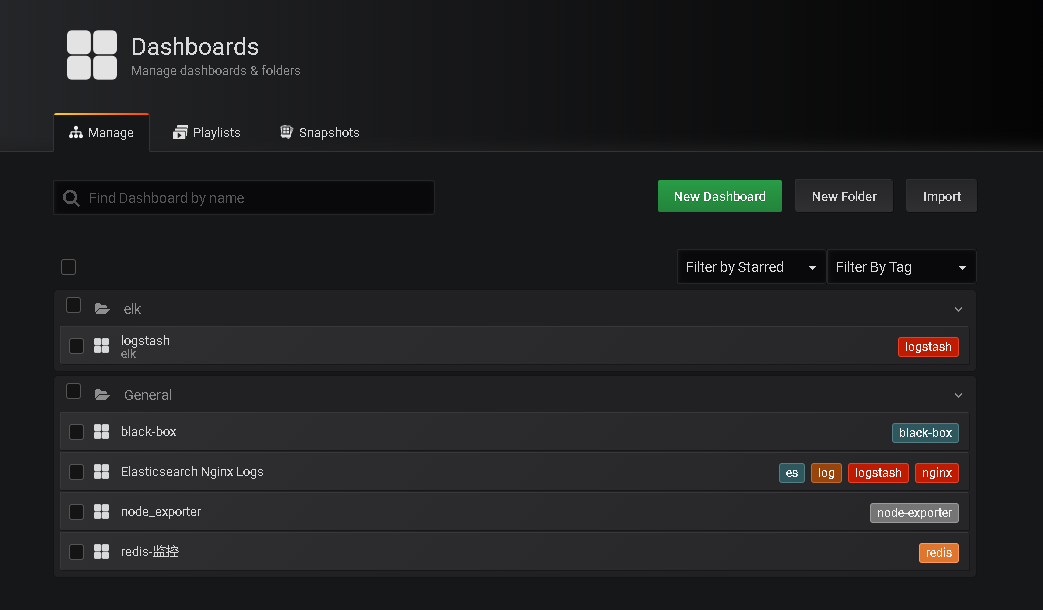
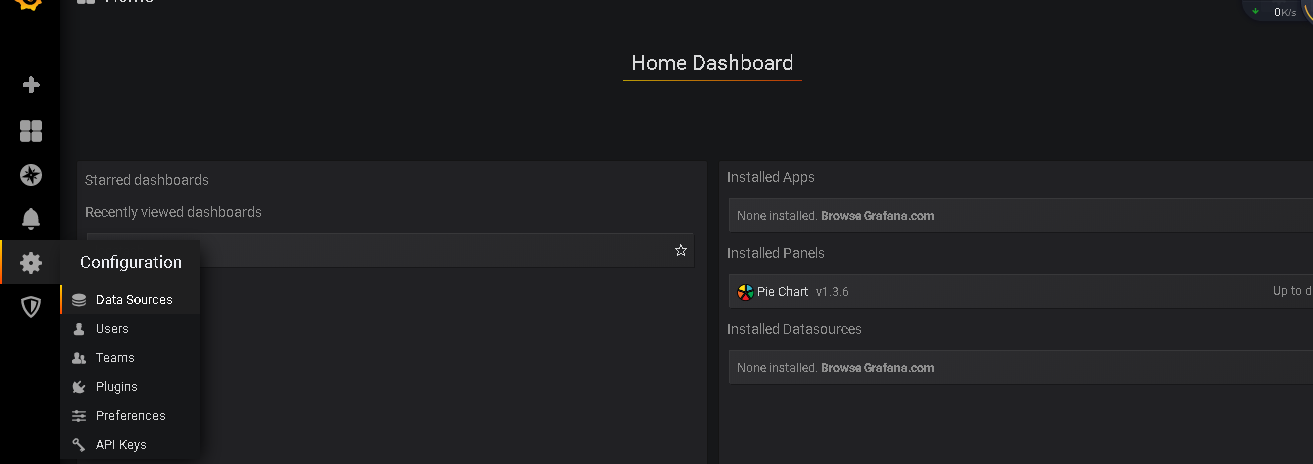
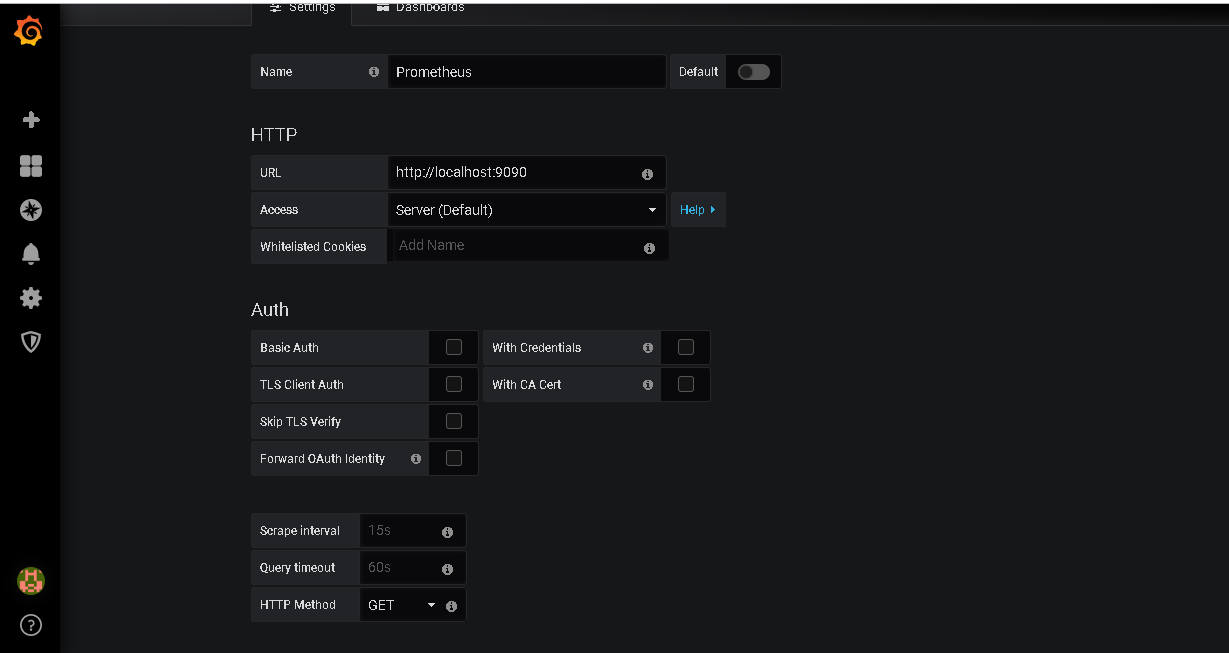
grafana
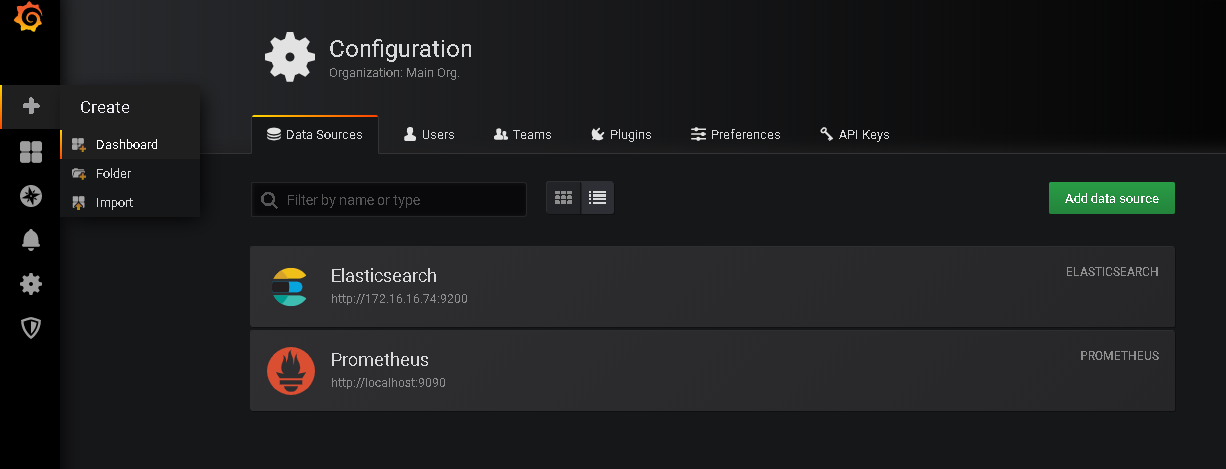
1.配置数据源
2.展示:
Dashboard建立一个模板
add query
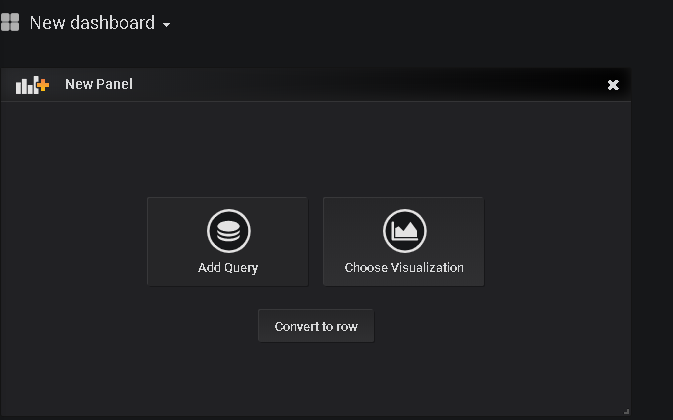
选择数据源
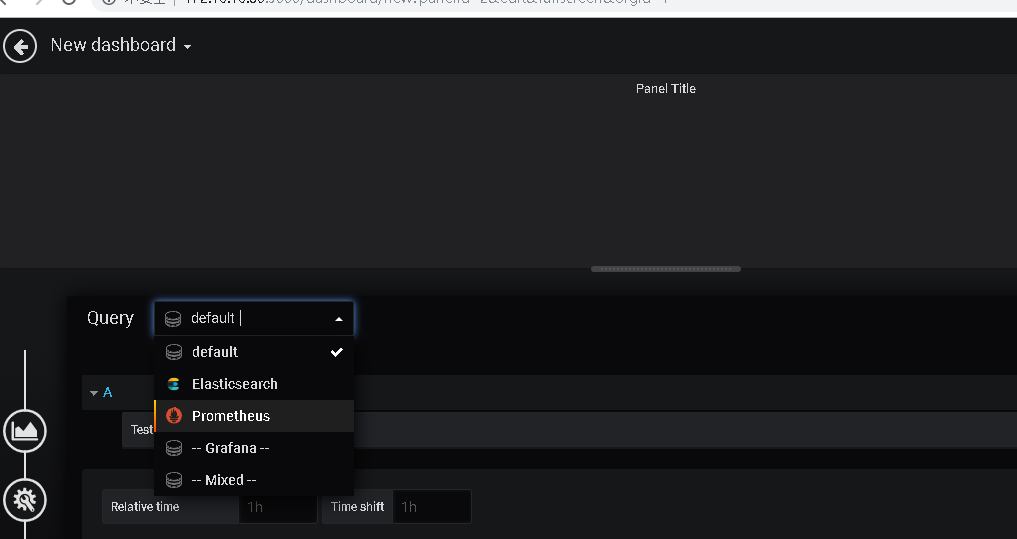
输入指标:node_load5{instance="localhost:9100"} / on (instance) count(count(node_cpu_seconds_total{instance="localhost:9100"}) by (instance,cpu))by(instance) * 100
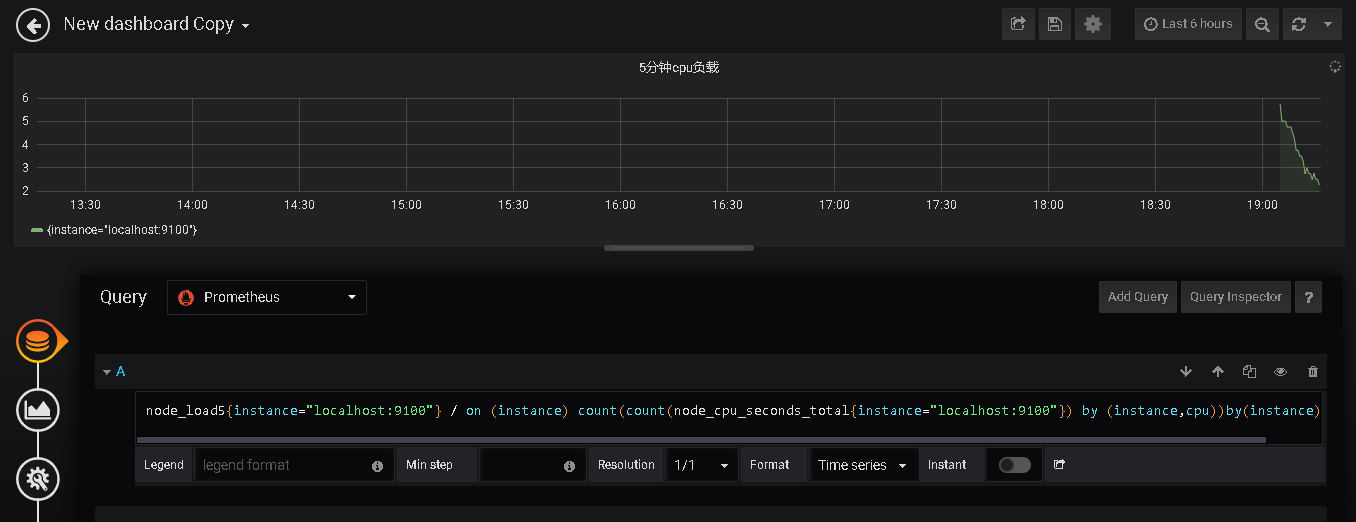
3.关于指标的问题只能自己搜索是咋用。而且指标只要访问9100这个端口都能看得到。后期会专门写一下常用的指标和grafana的一些用法
4.关于指标的使用个人用类似html标签理解,指标名称+各种属性过滤数据 node_load5{instance="localhost:9100"}
