Seaborn学习05:分布图(多坐标显示)
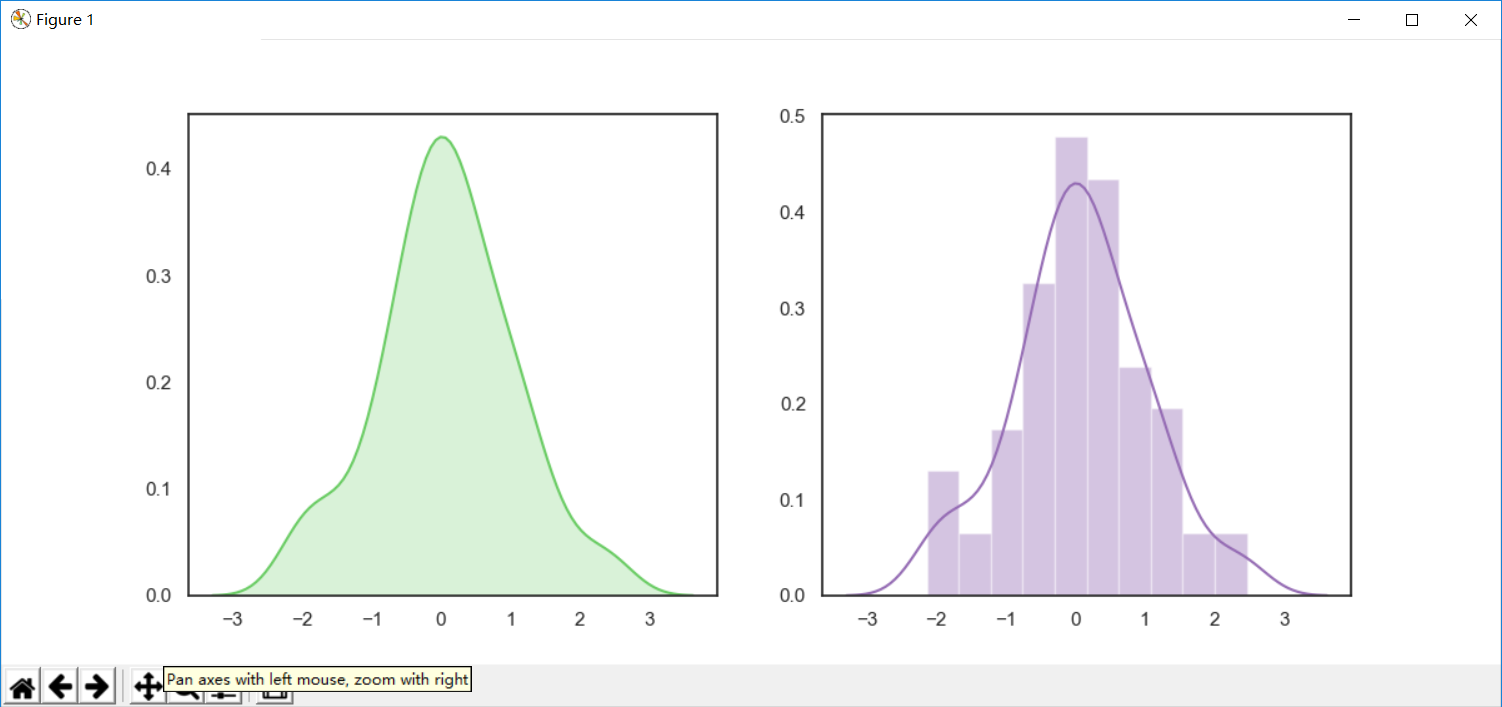
import numpy as np
import seaborn as sns
import matplotlib.pyplot as plt

sns.set(style="white", palette="muted", color_codes=True)
rs = np.random.RandomState(10)
d = rs.normal(size=100)
# 多个坐标显示
f, axes = plt.subplots(nrows=1, ncols=2, figsize=(12, 5))
sns.distplot(d, color="g", hist=False, kde_kws={"shade": True}, ax=axes[0])  # hist是否显示直方图
sns.distplot(d, color="m", ax=axes[1])
plt.show()
显示效果: