Scipy Lecture Notes学习笔记(一)Getting started with Python for science 1.3. NumPy: creating and manipulating numerical data
-
1.3. NumPy: creating and manipulating numerical data
创建和操作数值数据
摘要:
-
了解如何创建数组:
array,arange,ones,zeros。 -
了解数组的形状
array.shape,然后使用切片来获得数组的不同视图:array[::2]等等。使用reshape或调平数组的形状来调整数组的形状ravel。 -
获取数组元素的子集和/或用掩码修改它们的值
>>> a [ a < 0 ] = 0 -
知道数组上的其他操作,例如查找平均值或最大值(
array.max(),array.mean())。没有必要保留所有内容,但需要在文档中进行搜索(在线文档help(),,lookfor())! -
高级用途:掌握整数数组的索引,以及广播。知道更多的NumPy函数来处理各种数组操作。
numpy阵列:
- 高级数字对象:整数,浮点数
- 容器:列表(无成本的插入和追加),字典(快速查找)
输入:
import numpy as np
a = np.array([0, 1, 2, 3])
print(a)
print(a.ndim)
print(a.shape)输出:
[0 1 2 3]
1
(4,)
输入:
b = np.array([[0, 1, 2], [3, 4, 5]])    # 2 x 3 array
print(b.ndim)
print(b.shape)
len(b)
输出:
2
(2, 3)
2
输入;np.arrange()
a = np.arange(10) # 0 .. n-1  (!)
print(a)
b = np.arange(1, 9, 2) # start, end (exclusive), step
print(b)
输出:
[0 1 2 3 4 5 6 7 8 9]
[1 3 5 7]
numpy阵列的创建
arange,linspace,ones,zeros,eye和diag,输入:c = np.linspace(0, 1, 6) # start, end, num-points
print(c)
d = np.linspace(0, 1, 5, endpoint=False)
print(d)
e=np.ones(3)# 或者e=np.ones((3,3)) reminder: (3, 3) is a tuple
print(e)
f=np.eye(3,3)
print(f)
g=np.diag(np.array([1, 2, 3, 4]))
print(g)
h = np.zeros((2, 2))
print(h)
j = np.random.rand(4)
print(j)输出:
[0.  0.2 0.4 0.6 0.8 1. ]
[0.  0.2 0.4 0.6 0.8]
[1. 1. 1.]
[[1. 0. 0.]
 [0. 1. 0.]
 [0. 0. 1.]]
[[1 0 0 0]
 [0 2 0 0]
 [0 0 3 0]
 [0 0 0 4]]
[[0. 0.]
 [0. 0.]]
[0.15299073 0.98066181 0.05337565 0.23230675]
输入:
x=np.arange(1,16).reshape(3,5)
x
输出:
array([[ 1,  2,  3,  4,  5],
       [ 6,  7,  8,  9, 10],
       [11, 12, 13, 14, 15]])
1.3.1.4. Basic visualization
输入:
import matplotlib.pyplot as plt
x = np.linspace(0, 3, 20) #start,stop,step
y = np.linspace(0, 9, 20)
print(x)
print(y)
plt.plot(x, y)       # line plot
plt.plot(x, y, 'o')
plt.show()
输出:
[0.         0.15789474 0.31578947 0.47368421 0.63157895 0.78947368
 0.94736842 1.10526316 1.26315789 1.42105263 1.57894737 1.73684211
 1.89473684 2.05263158 2.21052632 2.36842105 2.52631579 2.68421053
 2.84210526 3.        ]
[0.         0.47368421 0.94736842 1.42105263 1.89473684 2.36842105
 2.84210526 3.31578947 3.78947368 4.26315789 4.73684211 5.21052632
 5.68421053 6.15789474 6.63157895 7.10526316 7.57894737 8.05263158
 8.52631579 9.        ]
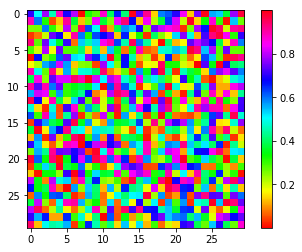
图像显示:
输入:
image = np.random.rand(30, 30)
plt.imshow(image, cmap=plt.cm.hsv)
plt.colorbar()
plt.show()
输出:
1.3.1.5. Indexing and slicing
类似于list,标号从零开始
输入:
a = np.arange(10)
print(a)
print(a[2:9:3]) # [start:end:step]
输出:
[0 1 2 3 4 5 6 7 8 9]
[2 5 8]
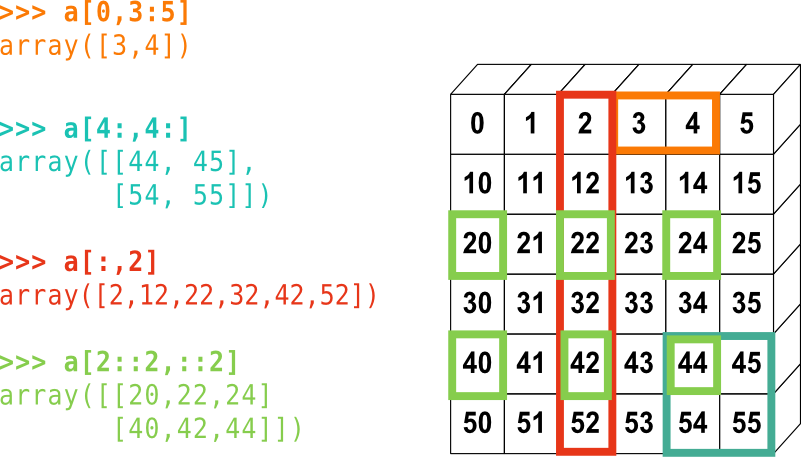
这张图片可以很好的说明numpy阵列的索引
-
Exercise: Indexing and slicing
-
Try the different flavours of slicing, using
start,endandstep: starting from a linspace, try to obtain odd numbers counting backwards, and even numbers counting forwards. -
Reproduce the slices in the diagram above. You may use the following expression to create the array:
输入:
import numpy as np
print(np.arange(6))
print(np.arange(0, 51, 10)[:, np.newaxis])
print(np.arange(6)+np.arange(0, 51, 10)[:, np.newaxis])
输出:
[0 1 2 3 4 5]
[[ 0]
 [10]
 [20]
 [30]
 [40]
 [50]]
[[ 0  1  2  3  4  5]
 [10 11 12 13 14 15]
 [20 21 22 23 24 25]
 [30 31 32 33 34 35]
 [40 41 42 43 44 45]
 [50 51 52 53 54 55]]
Exercise: Array creation
Create the following arrays (with correct data types):
Exercise: Array creation

Create the following arrays (with correct data types):

[[1, 1, 1, 1],
 [1, 1, 1, 1],
 [1, 1, 1, 2],
 [1, 6, 1, 1]]

[[0., 0., 0., 0., 0.],
 [2., 0., 0., 0., 0.],
 [0., 3., 0., 0., 0.],
 [0., 0., 4., 0., 0.],
 [0., 0., 0., 5., 0.],
 [0., 0., 0., 0., 6.]]
输入:
a=np.ones((4,4))
a[2,3]=2
a[3,1]=6
print(a)
输出:
[[1. 1. 1. 1.]
 [1. 1. 1. 1.]
 [1. 1. 1. 2.]
 [1. 6. 1. 1.]]
输入:
b=np.zeros((6,5))
b[1:6,0:5]=np.diag(np.arange(2,7))
b
输出:
array([[0., 0., 0., 0., 0.],
       [2., 0., 0., 0., 0.],
       [0., 3., 0., 0., 0.],
       [0., 0., 4., 0., 0.],
       [0., 0., 0., 5., 0.],
       [0., 0., 0., 0., 6.]])
1.3.2. Numerical operations on arrays
数组上的数值运算
1.3.2.1. Elementwise operations元素操作
所有的算术运算都是以元素的
输入:
a = np.array([1, 2, 3, 4])
print(a)
print(a+1)
print(2**a)
b = np.ones(4) + 1
print(a*b) #阵列乘法都是以元素为运算单位
print(a.dot(a))#如果想实现矩阵乘法,则采用.dot()运算
a = np.array([1, 1, 0, 0], dtype=bool)
b = np.array([1, 0, 1, 0], dtype=bool)
print(np.logical_or(a, b))
print(np.logical_and(a, b))
a = np.arange(1,5)
print(np.sin(a))
print(np.log(a))
print(np.exp(a))
a = np.triu(np.ones((3, 3)), 1)#构建上三角矩阵
print(a)
print(a.T) #矩阵转置
输出:
[1 2 3 4]
[2 3 4 5]
[ 2  4  8 16]
[2. 4. 6. 8.]
30
[ True  True  True False]
[ True False False False]
[ 0.84147098  0.90929743  0.14112001 -0.7568025 ]
[0.         0.69314718 1.09861229 1.38629436]
[ 2.71828183  7.3890561  20.08553692 54.59815003]
[[0. 1. 1.]
 [0. 0. 1.]
 [0. 0. 0.]]
[[0. 0. 0.]
 [1. 0. 0.]
 [1. 1. 0.]]
1.3.2.2. Basic reductions
sum(),min(),argmin(),argmax(),mean(),
输入:
x = np.array([1, 2, 3, 4])
print(x.sum())
x = np.array([[1, 1], [2, 2]])
print(x)
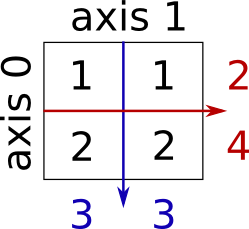
print(x.sum(axis=0))   # columns (first dimension)
print(x[:, 0].sum(), x[:, 1].sum())
print(x.sum(axis=1))   # rows (second dimension)
print(x[0, :].sum(), x[1, :].sum())
输出:
10
[[1 1]
 [2 2]]
[3 3]
3 3
[2 4]
2 4
输入:
x = np.array([1, 2, 3, 4])
print(x.min())
print(x.max())
print(x.argmin()) # index of minimum
print(x.argmax())  # index of maximum
输出:
1
4
0
3
输入:
x = np.array([1, 2, 3, 4])
print(x.min())
print(x.max())
print(x.argmin()) # index of minimum
print(x.argmax())  # index of maximum
print(x.mean())
print(np.median(x))
y = np.array([[1, 2, 3], [5, 6, 1]])
print(y)
print(np.median(y, axis=-1)) # last axis
print(x.std())
输出:
1
4
0
3
2.5
2.5
[[1 2 3]
 [5 6 1]]
[2. 5.]
1.118033988749895
输入:
a = np.zeros((100, 100))
print(np.any(a != 0))
print(np.all(a == a))
输出:
False
True
工作示例:使用随机游走算法进行扩散

让我们考虑一个简单的一维随机游走过程:在每个步骤中,步行者以相等的概率向右或向左跳。
我们感兴趣的是在t左或右跳之后寻找随机游走者的起源的典型距离?我们将模拟许多“步行者”来找到这条法则,我们将使用数组计算技巧来做到这一点:我们将在一个方向上创建一个带有“故事”(每个步行者都有故事)的2D数组:
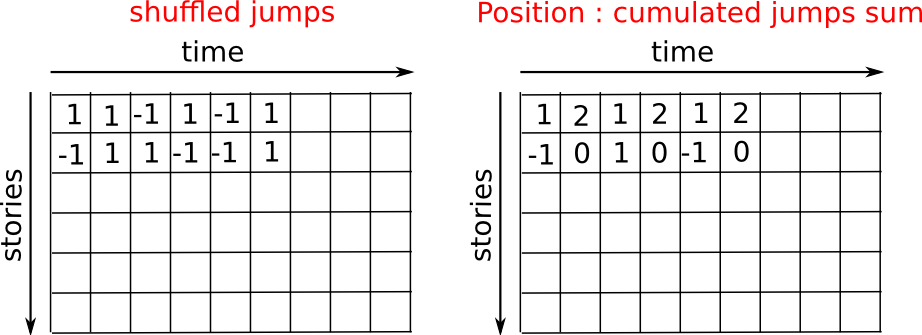
左图表示,从原点开始,如果开始第一步选择了向1正方向一定,那么此时位置为1,如果第二部步仍然选择了向正方向1移动,那么此时位置为2
n_stories = 1000 # number of walkers
t_max = 200      # time during which we follow the walker
t = np.arange(t_max)
steps = 2 * np.random.randint(0, 1 + 1, (n_stories, t_max)) - 1 # +1 because the high value is exclusive
#随机游走就是一个随机过程,我们让1000个人每次随机游走200步,用上述随机产生1或者-1模拟当前前进过程随机,前进或者
#后退的过程都是随机的
print('steps = ',steps)
print('unique(steps) = ',np.unique(steps)) # Verification: all steps are 1 or -1

#We build the walks by summing steps along the time:
positions = np.cumsum(steps, axis=1) # axis = 1: dimension of time
sq_distance = positions**2
print('positions=',positions) #positions是一个200*1000的结构
print('sq_distance=',sq_distance)

#We get the mean in the axis of the stories:
mean_sq_distance = np.mean(sq_distance, axis=0)

plt.figure(figsize=(4, 3))

plt.plot(t, np.sqrt(mean_sq_distance), 'g.', t, np.sqrt(t), 'y-')

plt.xlabel(r"$t$")

plt.ylabel(r"$\sqrt{\langle (\delta x)^2 \rangle}$")

plt.tight_layout() # provide sufficient space for labels
plt.show()
输出:
steps =  [[-1  1 -1 ...  1 -1 -1]
 [ 1  1 -1 ...  1  1  1]
 [-1  1 -1 ...  1  1 -1]
 ...
 [-1  1  1 ...  1 -1  1]
 [ 1 -1 -1 ... -1 -1 -1]
 [ 1  1 -1 ...  1  1 -1]]
unique(steps) =  [-1  1]
positions= [[ -1   0  -1 ...   0  -1  -2]
 [  1   2   1 ...   2   3   4]
 [ -1   0  -1 ...   4   5   4]
 ...
 [ -1   0   1 ... -20 -21 -20]
 [  1   0  -1 ... -10 -11 -12]
 [  1   2   1 ...   0   1   0]]
sq_distance= [[  1   0   1 ...   0   1   4]
 [  1   4   1 ...   4   9  16]
 [  1   0   1 ...  16  25  16]
 ...
 [  1   0   1 ... 400 441 400]
 [  1   0   1 ... 100 121 144]
 [  1   4   1 ...   0   1   0]]
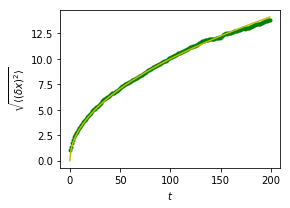
我们发现了一个众所周知的物理结果:RMS距离随着时间的平方根而增长!
1.3.2.3. Broadcasting
以下三种形式得到的最终结果是一样的
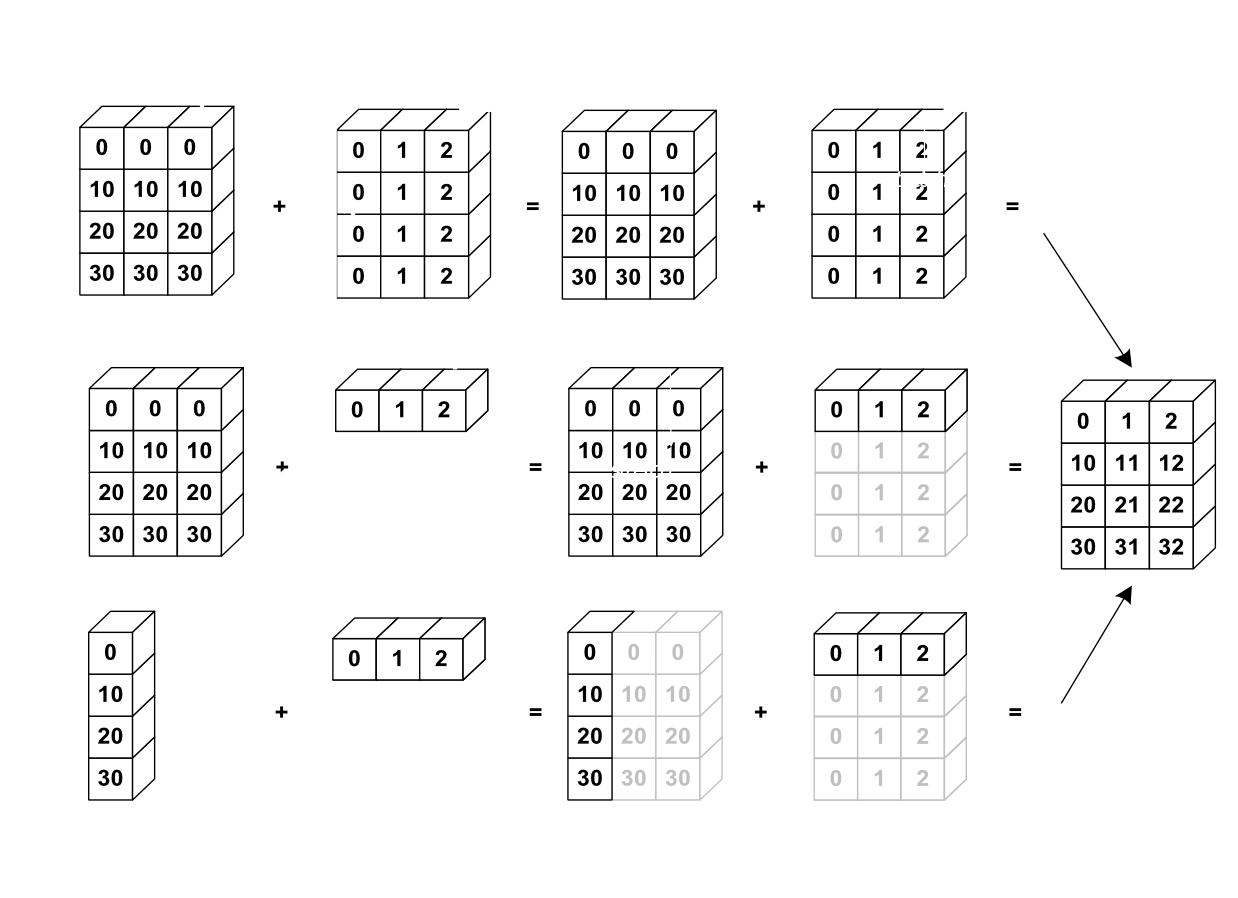
一个实用的trick
输入:
a = np.arange(0, 40, 10)
print(a.shape)
a = a[:, np.newaxis]  # adds a new axis -> 2D array
print(a.shape)
print('a=',a)
print('b=',b)
print('a + b=',a+b)
输出:
(4,)
(4, 1)
a= [[ 0]
 [10]
 [20]
 [30]]
b= [ True False  True False]
a + b= [[ 1  0  1  0]
 [11 10 11 10]
 [21 20 21 20]
 [31 30 31 30]]
输入:
x, y = np.arange(5), np.arange(5)[:, np.newaxis]
distance = np.sqrt(x ** 2 + y ** 2) #距离是两者平方之和
print(distance)
plt.pcolor(distance)
plt.colorbar()
plt.show()
输出:
[[0.         1.         2.         3.         4.        ]
 [1.         1.41421356 2.23606798 3.16227766 4.12310563]
 [2.         2.23606798 2.82842712 3.60555128 4.47213595]
 [3.         3.16227766 3.60555128 4.24264069 5.        ]
 [4.         4.12310563 4.47213595 5.         5.65685425]]

1.3.2.4. Array shape manipulation
平铺
输入:
a = np.array([[1, 2, 3], [4, 5, 6]])
print(a)
print(a.ravel())
输出:
[[1 2 3]
 [4 5 6]]
[1 2 3 4 5 6]
输入:
#注意: reshape may also return a copy!:
a = np.zeros((3, 2))
b = a.T.reshape(3*2)
b[0] = 9
a
输出:从结果可以看出,a的值并没有发生变化
array([[0., 0.],
       [0., 0.],
       [0., 0.]])
输入:
z = np.array([1, 2, 3])
print(z)
print(z[:, np.newaxis])
print(z[np.newaxis, :])
输出:
[1 2 3]
[[1]
 [2]
 [3]]
[[1 2 3]]
Experiment with transpose for dimension shuffling.
1.3.2.5. Sorting data
输入:
a = np.array([[4, 3, 5], [1, 2, 1]])
b = np.sort(a, axis=1)
b
输出:
array([[3, 4, 5],
       [1, 1, 2]])
输入:argsort函数,返回值是序列的顺序索引
a = np.array([4, 3, 1, 2])
j = np.argsort(a)
print(j)
print(a[j])
输出:
[2 3 1 0]
[1 2 3 4]


