1 载入matplotli的绘图模块,并重命名为plt
import matplotlib.pyplot as plt
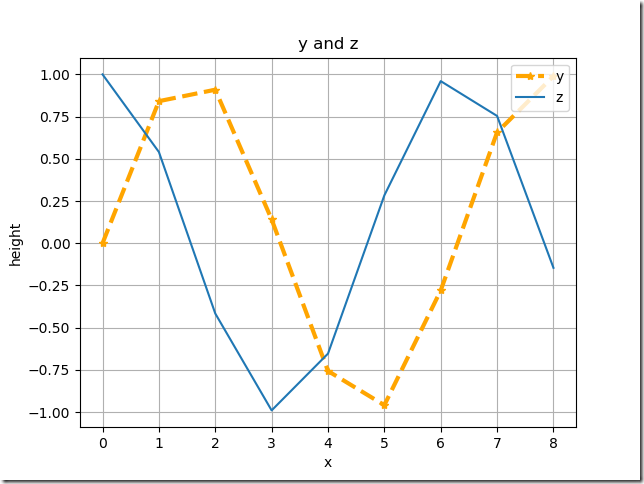
2 折线图
import matplotlib.pyplot as plt
import numpy as np
x = np.arange(9)
y = np.sin(x)
z = np.cos(x)
# marker数据点样式,linewidth线宽,linestyle线型样式,color颜色
plt.plot(x, y, marker="*", linewidth=3, linestyle="--", color="orange")
plt.plot(x, z)
plt.title("y and z")
plt.xlabel("x")
plt.ylabel('height')
# 设置图例
plt.legend(["y","z"], loc="upper right")
plt.grid(True)
plt.show()
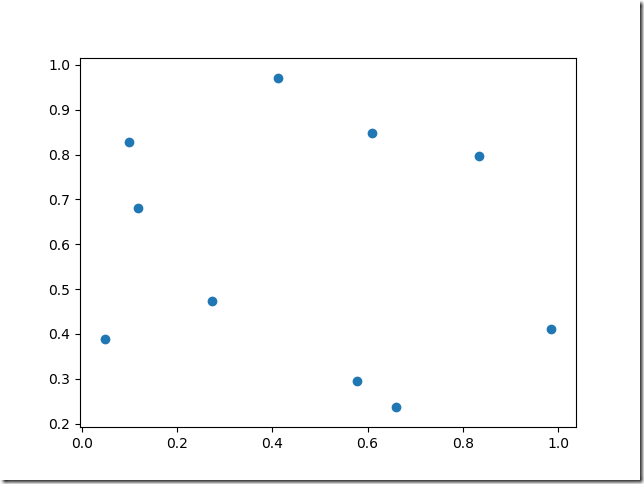
3 散点图
x = np.random.rand(10)
y = np.random.rand(10)
plt.scatter(x,y)
plt.show()
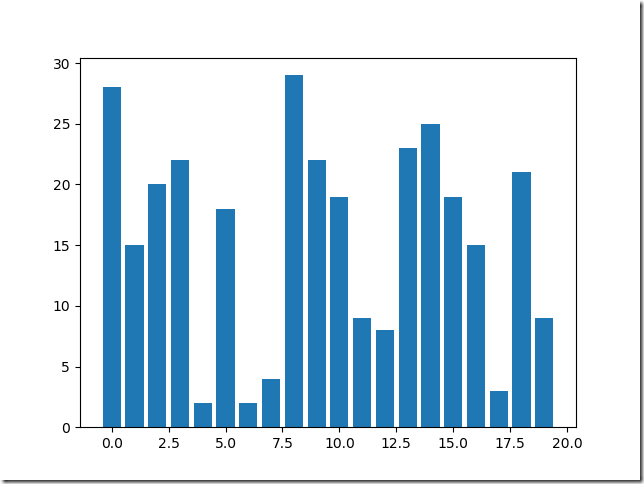
4 柱状图
x = np.arange(20)
y = np.random.randint(0,30,20)
plt.bar(x, y)
plt.show()
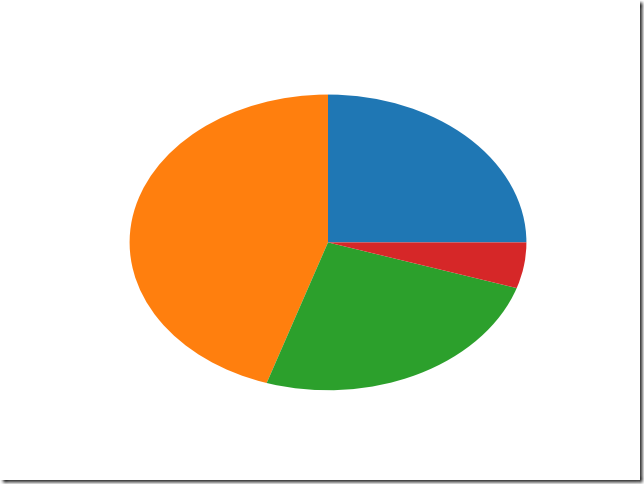
5 饼图
x = np.random.randint(1,10,4)
plt.pie(x)
plt.show()
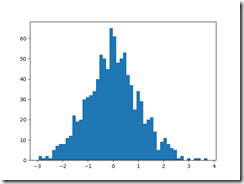
6 直方图
mean, sigma = 0, 1
x = mean + sigma*np.random.randn(1000)  #randn为产生正态分布
plt.hist(x,50)
plt.show()
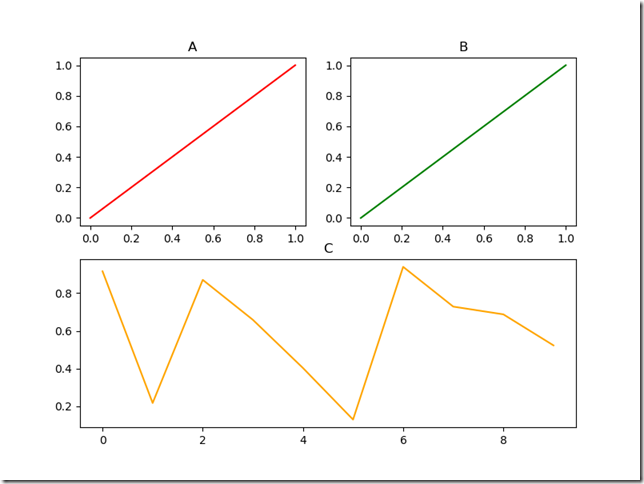
7 子图
subplot(numRows, numCols, plotNum) #行,列,区域号
# figsize绘图对象的宽度和高度,单位为英寸,dpi绘图对象的分辨率,即每英寸多少个像素,缺省值为80
plt.figure(figsize=(8,6),dpi=100)

# subplot(numRows, numCols, plotNum)
# 一个Figure对象可以包含多个子图Axes,subplot将整个绘图区域等分为numRows行*numCols列个子区域,按照从左到右,从上到下的顺序对每个子区域进行编号
# subplot在plotNum指定的区域中创建一个子图Axes
A = plt.subplot(2,2,1)
plt.plot([0,1],[0,1], color="red")
plt.subplot(2,2,2)
plt.title("B")
plt.plot([0,1],[0,1], color="green")
plt.subplot(2,1,2)
plt.title("C")
plt.plot(np.arange(10), np.random.rand(10), color="orange")
# 选择子图A
plt.sca(A)
plt.title("A")
plt.show()
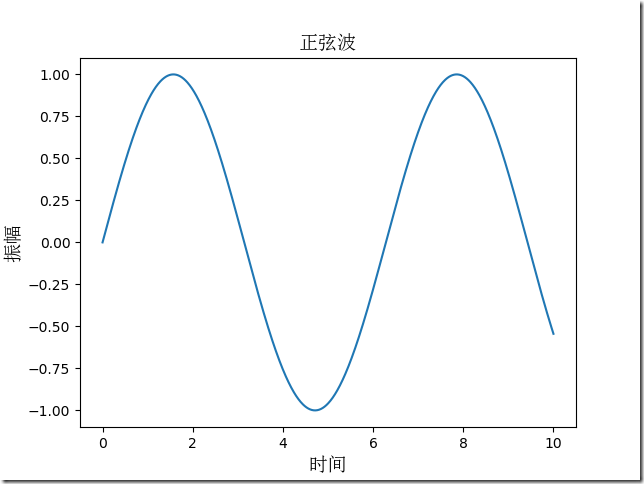
8 在图中显示中文
matplotlib默认无法显示中文,可直接在程序修改字体
from matplotlib.font_manager import FontProperties
import matplotlib.pyplot as plt
import numpy as np
font = FontProperties(fname=r"c:\windows\fonts\simsun.ttc", size=14)
t = np.linspace(0, 10, 1000)
y = np.sin(t)
plt.plot(t, y)
plt.xlabel(u"时间", fontproperties=font)
plt.ylabel(u"振幅", fontproperties=font)
plt.title(u"正弦波", fontproperties=font)
plt.show()
作者:huangqiancun
出处:http://www.cnblogs.com/huangqiancun/
本博客若无特殊说明则由作者原创发布,欢迎转载,但请注明出处 :)


