ELK+Filebeat 搭建
ELK+Filebeat的流程应该是这样的:Filebeat->Logstash->(Elasticsearch<->Kibana)由我们自己的程序产生出日志,由Filebeat进行处理,将日志数据输出到Logstash中,Logstash再将数据输出到Elasticsearch中,Elasticsearch再与Kibana相结合展示给用户。
Elasticsearch: 能对大容量的数据进行接近实时的存储,搜索和分析操作。
Logstash: 数据收集引擎,它支持动态的的从各种数据源获取数据,并对数据进行过滤,分析,丰富,统一格式等操作,然后存储到用户指定的位置。
Kibana: 数据分析与可视化平台,对Elasticsearch存储的数据进行可视化分析,通过表格的形式展现出来。
Filebeat: 轻量级的开源日志文件数据搜集器。通常在需要采集数据的客户端安装Filebeat,并指定目录与日志格式,Filebeat就能快速收集数据,并发送给logstash进行解析,或是直接发给Elasticsearch存储
ElasticSearch 搭建
首先 在local下面创建elk目录 然后下载elasticsearch,logstash,kibana
cd usr/local
mkdir elk
解压
tar -xzvf elasticsearch-6.6.0.tar.gz -C /usr/local/elk
tar -xzvf logstash-6.6.0.tar.gz -C /usr/local/elk
tar -xzvf kibana-6.6.0-linux-x86_64.tar.gz
root用户建议不直接启动es
[root@master-node ~]# vim /etc/elasticsearch/elasticsearch.yml # 增加或更改以下内容
查看后台命令是否启动成功 ps aux|grep elasticsearch
这是出于系统安全考虑设置的条件。由于ElasticSearch可以接收用户输入的脚本并且执行,为了系统安全考虑,
建议创建一个单独的用户用来运行ElasticSearch
创建elsearch用户组及elsearch用户
groupadd elsearch
组名 密码
useradd elsearch -g elsearch -p elk
更改elasticsearch文件夹及内部文件的所属用户及组为elsearch:elsearch
用root用户执行 : chown -R 用户名 文件夹名
chown -R elsearch:elsearch elasticsearch-6.6.0
elasticsearch-6.6.0为你elasticsearch的目录名称
切换到elsearch用户再启动
su elsearch #切换账户
cd elasticsearch/bin #进入你的elasticsearch目录下的bin目录
./elasticsearch
elasticsearch.yml 文件用于配置集群节点等相关信息的
cluster.name: master-node # 集群中的名称
node.name: master # 该节点名称
node.master: true # 意思是该节点为主节点
node.data: false # 表示这不是数据节点
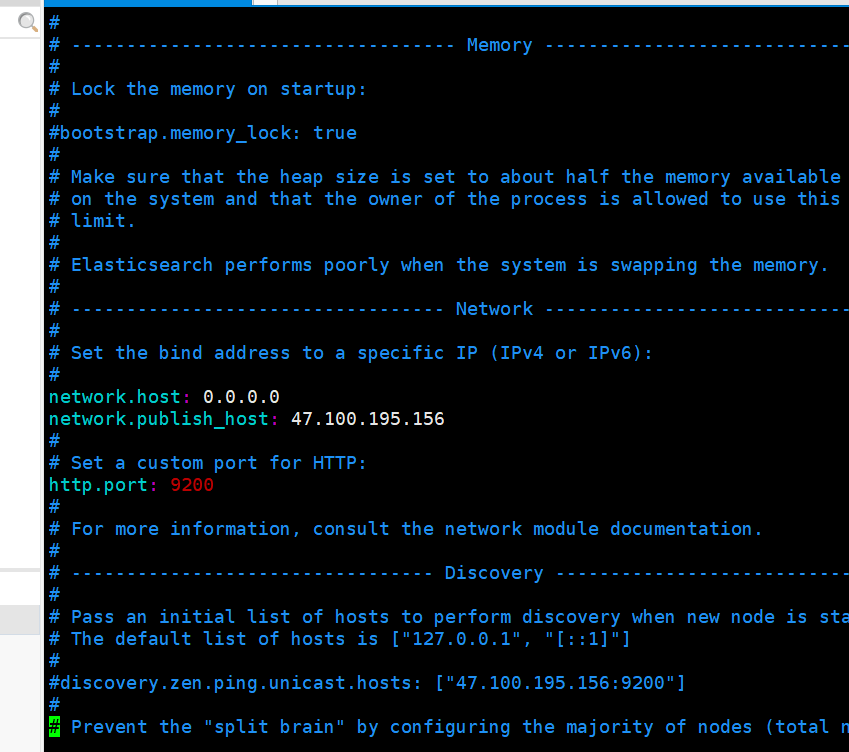
network.host: 0.0.0.0 # 监听全部ip,在实际环境中应设置为一个安全的ip
http.port: 9200 # es服务的端口号
discovery.zen.ping.unicast.hosts: ["192.168.77.128", "192.168.77.130", "192.168.77.134"] # 配置自动发现
[root@master-node ~]#
ElasticSearch后台启动命令 ./elasticsearch
curl http://127.0.0.1:9200/
curl http://127.0.0.1:9200/
nohup./bin/elasticsearch&
异常:max virtual memory areas vm.max_map_count [65530]is too low, increase to at least [262144
vim etc/sysctl.conf
vm.max_map_count=262144
sysctl -p
sysctl -a|grep vm.max_map_count
显示:
vm.max_map_count = 262144
异常:max file descriptors [4096] for elasticsearch process is too low, increase to at least [65536]
#切换到root用户修改
vim /etc/security/limits.conf
# 在最后面追加下面内容
*** hard nofile 65536
*** soft nofile 65536
elasticsearch要进行外网访问,需要修改config目录下elasticsearch.yml文件,
network.publish_host: 外网ip地址
network.host: 0.0.0.0 全网ip
查询端口是否有进程守护用如下命令grep对应端口,如9200为端口号
例:netstat -nalp|grep 9200
注意顺序,network.host 放上面,
但是外网是访问不了的。
如果要配置成外网。需要把 network.publish_host : 配置成外网ip 即可。
在阿里云上配置对外的开放的9200端口号
elasticsearch配置文件详解
elasticsearch的config文件夹里面有两个配置文 件:elasticsearch.yml和logging.yml,第一个是es的基本配置文件,第二个是日志配置文件,es也是使用log4j来记录日 志的,所以logging.yml里的设置按普通log4j配置文件来设置就行了。下面主要讲解下elasticsearch.yml这个文件中可配置的 东西。
cluster.name: elasticsearch
配置es的集群名称,默认是elasticsearch,es会自动发现在同一网段下的es,如果在同一网段下有多个集群,就可以用这个属性来区分不同的集群。
node.name: "Franz Kafka"
节点名,默认随机指定一个name列表中名字,该列表在es的jar包中config文件夹里name.txt文件中,其中有很多作者添加的有趣名字。
node.master: true
指定该节点是否有资格被选举成为node,默认是true,es是默认集群中的第一台机器为master,如果这台机挂了就会重新选举master。
node.data: true
指定该节点是否存储索引数据,默认为true。
index.number_of_shards: 5
设置默认索引分片个数,默认为5片。
index.number_of_replicas: 1
设置默认索引副本个数,默认为1个副本。
path.conf: /path/to/conf
设置配置文件的存储路径,默认是es根目录下的config文件夹。
path.data: /path/to/data
设置索引数据的存储路径,默认是es根目录下的data文件夹,可以设置多个存储路径,用逗号隔开,例:
path.data: /path/to/data1,/path/to/data2
path.work: /path/to/work
设置临时文件的存储路径,默认是es根目录下的work文件夹。
path.logs: /path/to/logs
设置日志文件的存储路径,默认是es根目录下的logs文件夹
path.plugins: /path/to/plugins
设置插件的存放路径,默认是es根目录下的plugins文件夹
bootstrap.mlockall: true
设置为true来锁住内存。因为当jvm开始swapping时es的效率 会降低,所以要保证它不swap,可以把ES_MIN_MEM和ES_MAX_MEM两个环境变量设置成同一个值,并且保证机器有足够的内存分配给es。 同时也要允许elasticsearch的进程可以锁住内存,linux下可以通过`ulimit -l unlimited`命令。
network.bind_host: 192.168.0.1
设置绑定的ip地址,可以是ipv4或ipv6的,默认为0.0.0.0。
network.publish_host: 192.168.0.1
设置其它节点和该节点交互的ip地址,如果不设置它会自动判断,值必须是个真实的ip地址。
network.host: 192.168.0.1
这个参数是用来同时设置bind_host和publish_host上面两个参数。
transport.tcp.port: 9300
设置节点间交互的tcp端口,默认是9300。
transport.tcp.compress: true
设置是否压缩tcp传输时的数据,默认为false,不压缩。
http.port: 9200
设置对外服务的http端口,默认为9200。
http.max_content_length: 100mb
设置内容的最大容量,默认100mb
http.enabled: false
是否使用http协议对外提供服务,默认为true,开启。
gateway.type: local
gateway的类型,默认为local即为本地文件系统,可以设置为本地文件系统,分布式文件系统,hadoop的HDFS,和amazon的s3服务器,其它文件系统的设置方法下次再详细说。
gateway.recover_after_nodes: 1
设置集群中N个节点启动时进行数据恢复,默认为1。
gateway.recover_after_time: 5m
设置初始化数据恢复进程的超时时间,默认是5分钟。
gateway.expected_nodes: 2
设置这个集群中节点的数量,默认为2,一旦这N个节点启动,就会立即进行数据恢复。
cluster.routing.allocation.node_initial_primaries_recoveries: 4
初始化数据恢复时,并发恢复线程的个数,默认为4。
cluster.routing.allocation.node_concurrent_recoveries: 2
添加删除节点或负载均衡时并发恢复线程的个数,默认为4。
indices.recovery.max_size_per_sec: 0
设置数据恢复时限制的带宽,如入100mb,默认为0,即无限制。
indices.recovery.concurrent_streams: 5
设置这个参数来限制从其它分片恢复数据时最大同时打开并发流的个数,默认为5。
discovery.zen.minimum_master_nodes: 1
设置这个参数来保证集群中的节点可以知道其它N个有master资格的节点。默认为1,对于大的集群来说,可以设置大一点的值(2-4)
discovery.zen.ping.timeout: 3s
设置集群中自动发现其它节点时ping连接超时时间,默认为3秒,对于比较差的网络环境可以高点的值来防止自动发现时出错。
discovery.zen.ping.multicast.enabled: false
设置是否打开多播发现节点,默认是true。
discovery.zen.ping.unicast.hosts: ["host1", "host2:port", "host3[portX-portY]"]
设置集群中master节点的初始列表,可以通过这些节点来自动发现新加入集群的节点。
安装elasticsearch -head 插件
tar xvf node-v10.15.1-linux-x64.tar.xz
unzip master.zip
export NODE_PATH=/usr/local/node/node-v10.15.1-linux-x64
export PATH=$PATH:$JAVA_HOME/bin:$NODE_PATH/bin
.配置head
进入head文件中
执行 npm install -g grunt-cli
执行 npm install ,此过程会下载phantomjs (运行npm install时,可能PhantomJS not found on PATH ...可执行 npm install latest)
1.修改 elasticsearch/config/elasticsearch.yml
http.cors.enabled: true
http.cors.allow-origin: "*"
(2):修改elasticsearch-head下的Gruntfile.js
#其中增加一个
hostname: '0.0.0.0' 或者是 hostname: '*'
(3)cd /usr/local/es/elasticsearch-head/_site/
vim app.js
打开文件 在命令行模式输入 “/this.base_uri” 进行搜索
然后修改为
this.base_uri = this.config.base_uri || this.prefs.get("app-base_uri") || "http://you ip address:9200";
打开文件 在命令行模式输入 “/this.base_uri” 进行搜索
然后修改为
this.base_uri = this.config.base_uri || this.prefs.get("app-base_uri") || "http://172.19.208.138:9200";
启动elasticsearch
/usr/local/es/node-1/bin/elasticsearch -d
启动elasticsearch-head服务
/usr/local/es/elasticsearch-head/node_modules/grunt/bin/grunt server
如果要后台启动 nohup /usr/local/es/elasticsearch-head/node_modules/grunt/bin/grunt server & exit
Logstash配置
Logstash其实就是一个收集器,使用时需要为它指定Input和Output(Input和Output可以为多个)。比如若把Java代码中Log4j的日志输出到ElasticSearch中,Input就是Log4j,而Output就是ElasticSearch。
配置文件
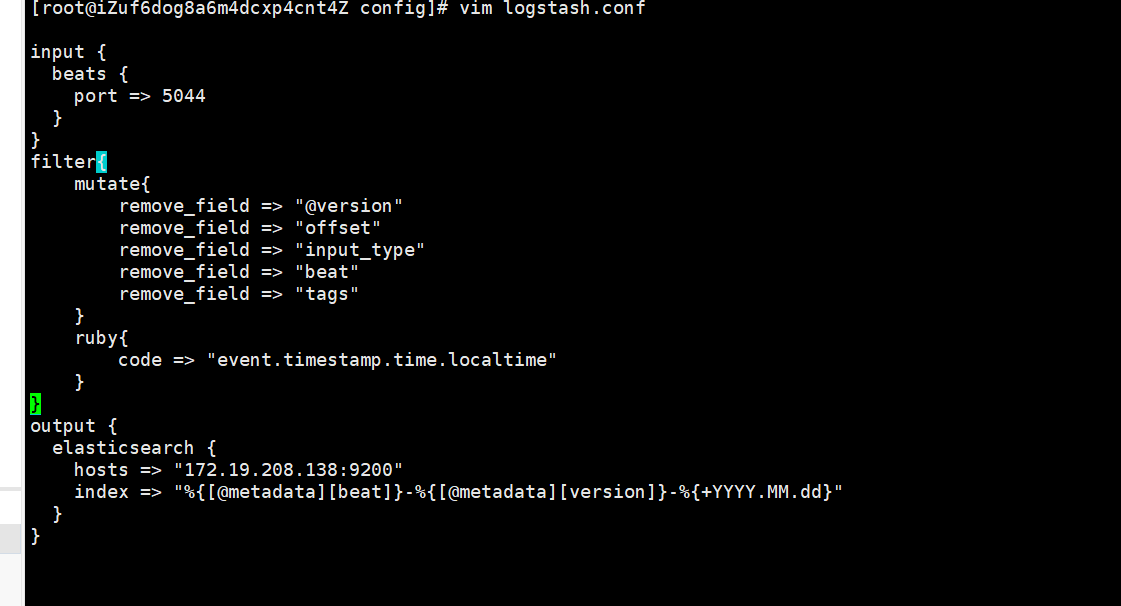
这里配置输入filebeat.输出到ElasticSearch.
# bin/logstash -e 'input{stdin{}}output{stdout{codec=>rubydebug}}'
然后随意输入hello 回车,然后看看返回结果
这样安装就没有问题 。
bin目录新建 logstash.conf
然后通过 bin/logstash -f logstash.conf 这样的形式来运行。
此外,logstash 还提供一个方便我们规划和书写配置的小功能.可以直接用 bin/logstash -f /etc/logstash.d/ 来运行。
logstash 会自动读取 /etc/logstash.d/ 目录下所有 *.conf 的文本文件,然后在自己内存里拼接成一个完整的大配置文件,再去执行。
新建 logstash.conf
遇到的问题:
(/usr/local/elk/elasticsearch-6.6.0/logs/master-node.log) java.io.FileNotFoundException: /usr/local/elk/elasticsearch-6.6.0/logs/master-node.log (Permission denied) java.io.FileNotFoundException: /usr/local/elk/elasticsearch-6.6.0/logs/master-node.log (Permission denied)
修改log日志文件的所属权【选操作,如果已经是要启动的用户,则无视】
修改logs/master-node.log
chown elsearch master-node.log
chgrp elsearch master-node.log
异常 IllegalStateException
Caused by: java.lang.IllegalStateException: failed to obtain node locks, tried [[/opt/elasticsearch-5.5.2/data/ymq]] with lock id [0]; maybe thes
删除 安装目录下/data
rm -rf nodes
Kibana
配置文件
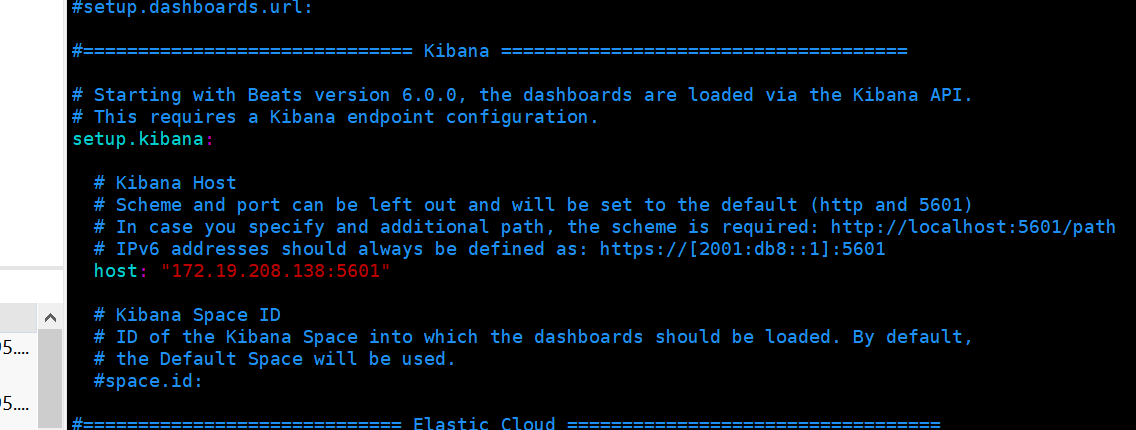
在kibana的config目录下kibana.yml
# Kibana is served by a back end server. This setting specifies the port to use.
server.port: 5601
# To allow connections from remote users, set this parameter to a non-loopback address.
server.host: "localhost"
# The URL of the Elasticsearch instance to use for all your queries.
# 这里配置的Elasticsearch的链接地址
elasticsearch.url: "http://192.168.2.12:9200"
# Kibana uses an index in Elasticsearch to store saved searches, visualizations and
# dashboards. Kibana creates a new index if the index doesn't already exist.
kibana.index: ".kibana"
filebeats 安装
tar -zxvf filebeat-6.6.0-linux-x86_64.tar.gz
filebeat配置:
cd usr/local/elk/filebeat-6.6.0/
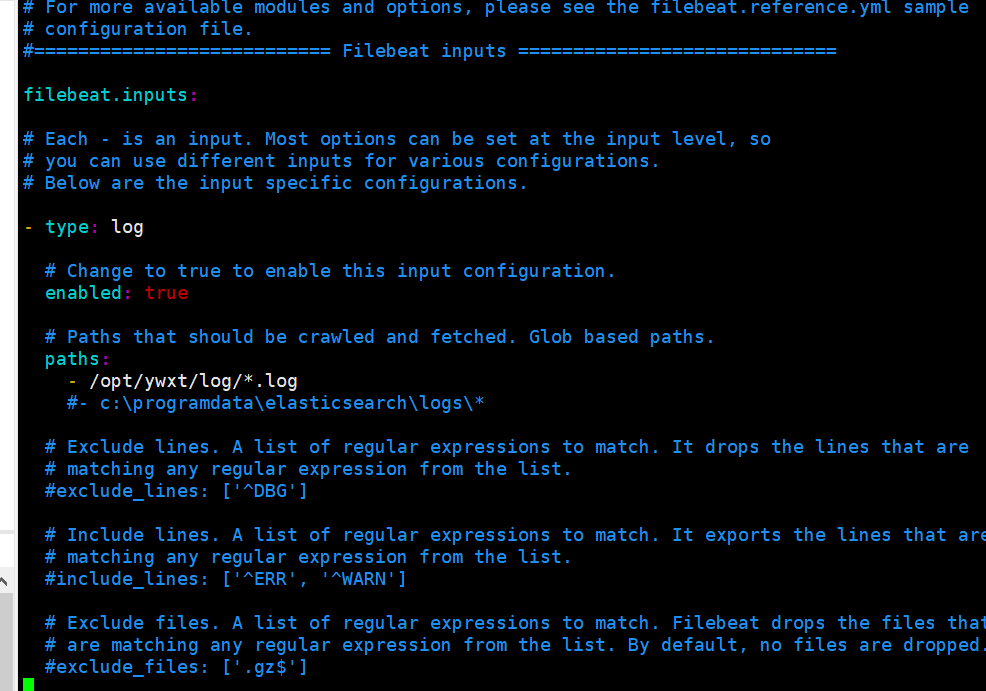
vim filebeat.yml
修改配置filebeat.yml:
- input_type: log
# Paths that should be crawled and fetched. Glob based paths.
paths:
- /var/log/*.log
- /opt/ywxt/log/*.log #修改扫描输入路径(可以配置多个路径)
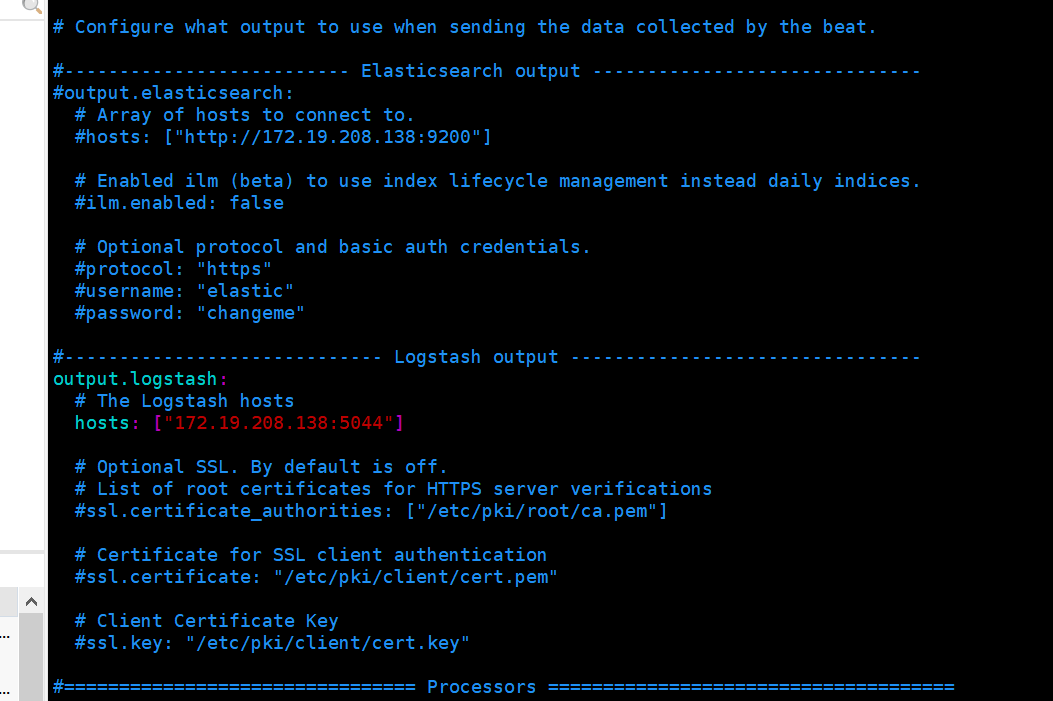
屏蔽elasticsearch 配置
当filebeats配合logstash使用,需要手动load the index template in ElasticSearch,就是filberts直连ElasticSearch load 数据,命令如下:
./filebeat setup --template -E output.logstash.enabled=false -E 'output.elasticsearch.hosts=["172.19.208.138:9200"]'
启动:
./filebeat -e -c filebeat.yml
默认的Elasticsearch需要的index template在安装Filebeat的时候已经提供,路径为/etc/filebeat/filebeat.template.json,可以使用如下命令装载该模板:
$ curl -XPUT 'http://localhost:9200/_template/filebeat?pretty' -d@/etc/filebeat/filebeat.template.json
1
当然,也不能忘了,每次修改完Filebeat的配置后,需要重启Filebeat才能让改动的配置生效。
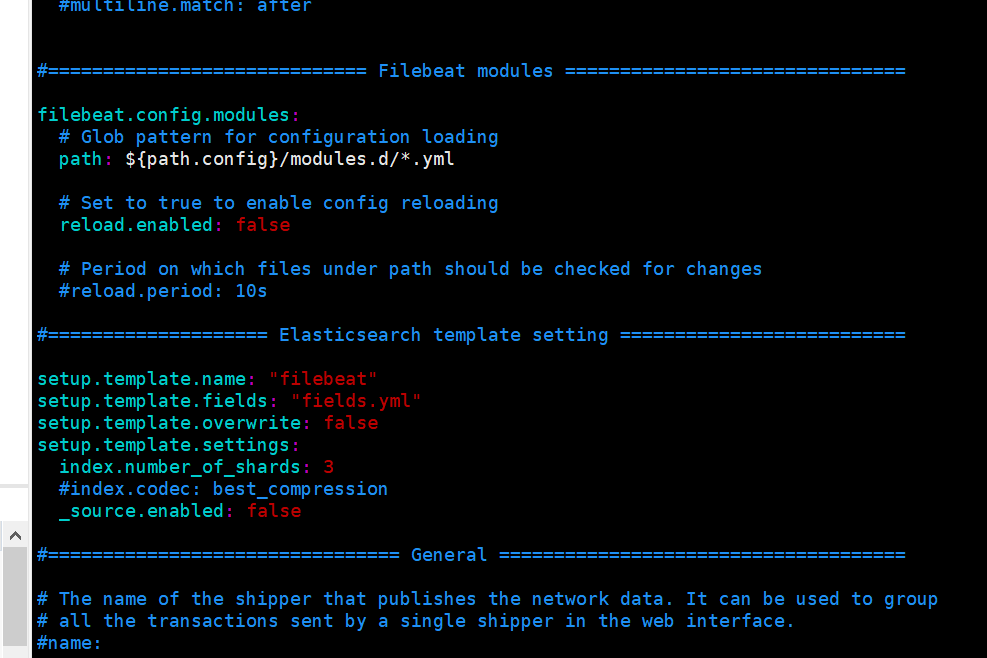
修改filebeat配置
setup.template.name: "filebeat"
setup.template.fields: "fields.yml"
setup.template.overwrite: false
setup.template.settings:
_source.enabled: false
Filebeat附带了示例Kibana仪表板,可视化和搜索,以便在Kibana中可视化Filebeat数据。在使用仪表板之前,
您需要创建索引模式filebeat-*,并将仪表板加载到Kibana中。为此,您可以运行setup命令(如此处所述)或在配置文件中配置仪表板加载filebeat.yml。(我这里暂时选用此种方式)
filebeat setup --dashboards
../bin/logstash -f logstash.conf
这需要注意默认是开启es的,注释掉,配置logstsah