CSS打造超炫进度条、柱状图
题目有点标题党了,先来个图弥补一下。
怎么样,是不是有点心动了,完全CSS+Div打造。再看一下简单而又漂亮的
是不是也还可以呢?下面看下代码是怎样的
css:
 代码
代码
1 .graph {
2 position: relative;
3 width: 200px;
4 border: 1px solid #B1D632;
5 padding: 2px;
6 margin-bottom: .5em;
7 }
8 .graph .bar {
9 display: block;
10 position: relative;
11 background: #B1D632;
12 text-align: center;
13 color: #333;
14 height: 2em;
15 line-height: 2em;
16 }
17 .graph .bar span { position: absolute; left: 1em; }
HTML:
 代码
代码
1 <h3>简单进度条</h3>
2 <div class="graph">
3 <strong class="bar" style="width: 54%;"><span>54%</span></strong>
4 </div>
5 <div class="graph">
6 <strong class="bar" style="width: 8%;"><span>8%</span></strong>
7 </div>
8
2 <div class="graph">
3 <strong class="bar" style="width: 54%;"><span>54%</span></strong>
4 </div>
5 <div class="graph">
6 <strong class="bar" style="width: 8%;"><span>8%</span></strong>
7 </div>
8
只要改变bar的width就可以随意改变进度条的长度,简单易用吧。
再看上面复杂的代码又是怎么实现的
CSS:
 代码
代码
1 /* 复杂进度条 */
2 dl {
3 margin: 0;
4 padding: 0;
5 }
6 dt {
7 position: relative;
8 clear: both;
9 display: block;
10 float: left;
11 width: 104px;
12 height: 20px;
13 line-height: 20px;
14 margin-right: 17px;
15 font-size: .75em;
16 text-align: right;
17 }
18 dd {
19 position: relative;
20 display: block;
21 float: left;
22 width: 197px;
23 height: 20px;
24 margin: 0 0 15px;
25 background: url("g_colorbar.jpg");
26 }
27 * html dd { float: none; } /*此处为 IE hack */
28
29 dd div {
30 position: relative;
31 background: url("g_colorbar2.jpg");
32 height: 20px;
33 width: 75%;
34 text-align:right;
35 }
36 dd div strong {
37 position: absolute;
38 right: -5px;
39 top: -2px;
40 display: block;
41 background: url("g_marker.gif");
42 height: 24px;
43 width: 9px;
44 text-align: left;
45 text-indent: -9999px;
46 overflow: hidden;
47 }
48
HTML:
 代码
代码
1 <h3>复杂进度条</h3>
2 <dl>
3 <dt>喜欢博客园</dt>
4 <dd>
5 <div style="width:25%;"><strong>25%</strong></div>
6 </dd>
7 <dt>很喜欢</dt>
8 <dd>
9 <div style="width:55%;"><strong>55%</strong></div>
10 </dd>
11 <dt>超级喜欢</dt>
12 <dd>
13 <div style="width:75%;"><strong>75%</strong></div>
14 </dd>
15 </dl>
16
2 <dl>
3 <dt>喜欢博客园</dt>
4 <dd>
5 <div style="width:25%;"><strong>25%</strong></div>
6 </dd>
7 <dt>很喜欢</dt>
8 <dd>
9 <div style="width:55%;"><strong>55%</strong></div>
10 </dd>
11 <dt>超级喜欢</dt>
12 <dd>
13 <div style="width:75%;"><strong>75%</strong></div>
14 </dd>
15 </dl>
16
CSS中用到了几个图片在示例代码下载中有。使用方法同样简单。
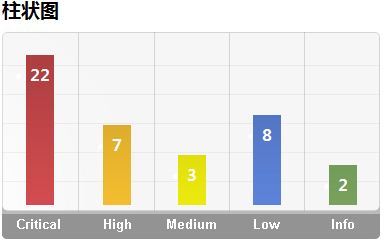
再看一下柱状图的效果:
我觉得这个是最炫的(偷笑一个^_^)其实最主要的地方在图片上,代码就不贴了,有兴趣的请下载示例代码。
本文参考:
作者:gudao119
出处:https://www.cnblogs.com/gudao119/archive/2010/01/11/1643882.html
版权:本作品采用「署名-非商业性使用-相同方式共享 4.0 国际」许可协议进行许可。

 题目有点标题党了,先来个图弥补一下。
怎么样,是不是有点心动了,完全CSS+Div打造。再看一下简单而又漂亮的


【推荐】编程新体验,更懂你的AI,立即体验豆包MarsCode编程助手
【推荐】凌霞软件回馈社区,博客园 & 1Panel & Halo 联合会员上线
【推荐】抖音旗下AI助手豆包,你的智能百科全书,全免费不限次数
【推荐】博客园社区专享云产品让利特惠,阿里云新客6.5折上折
【推荐】轻量又高性能的 SSH 工具 IShell:AI 加持,快人一步
· 没有源码,如何修改代码逻辑?
· 一个奇形怪状的面试题:Bean中的CHM要不要加volatile?
· [.NET]调用本地 Deepseek 模型
· 一个费力不讨好的项目,让我损失了近一半的绩效!
· .NET Core 托管堆内存泄露/CPU异常的常见思路
· 微软正式发布.NET 10 Preview 1:开启下一代开发框架新篇章
· 没有源码,如何修改代码逻辑?
· NetPad:一个.NET开源、跨平台的C#编辑器
· PowerShell开发游戏 · 打蜜蜂
· 在鹅厂做java开发是什么体验