D3.js 加标签
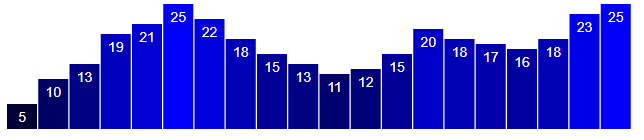
条形图还可以配上实际的数值,我们通过文本元素添加数据值。
svg.selectAll("text")
    .data(dataset)
    .enter()
    .append("text")
    .text(function(d){
        return d;
    })
通过 x 和 y 值来定位文本元素。
               .attr("text-anchor", "middle")
               .attr("x", function(d, i) {
                       return i * (w / dataset.length) + (w / dataset.length - barPadding) / 2;
               })
               .attr("y", function(d) {
                       return h - (d * 4) + 14;
               })
               .attr("font-family", "sans-serif")
               .attr("font-size", "11px")
               .attr("fill", "white");
结果如图所示: