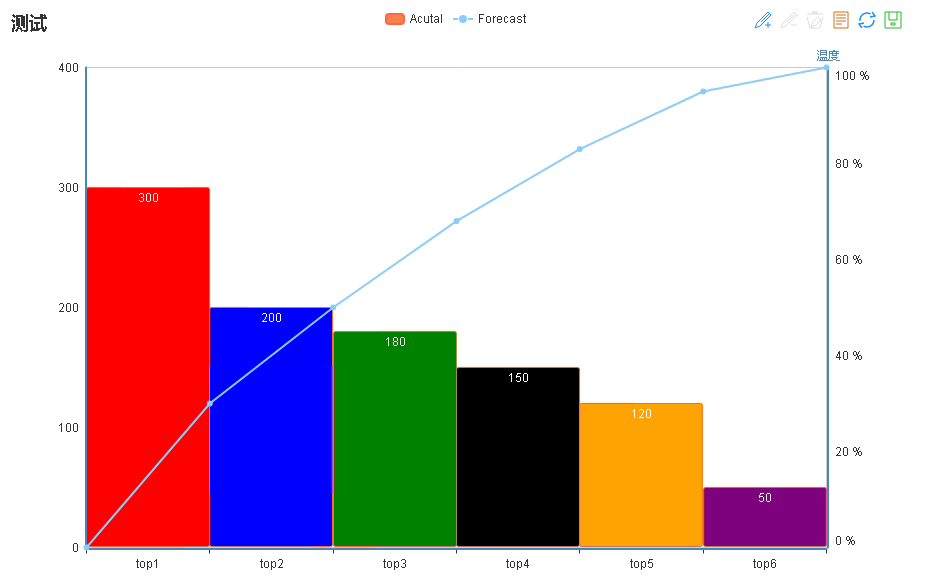
Echarts作图之柏拉图

Echarts版本:2.2.7


<!DOCTYPE html>
<html>

<head>
    <meta charset="utf-8">
    <title></title>
    <script type="text/javascript" src="echarts/echarts.js"></script>
    <script type="text/javascript">
    window.onload = function() {
        require([
            'echarts',
            'echarts/chart/bar',
            'echarts/chart/line',
        ], function(ec) {
            var chartDom = document.getElementById("dv");
            console.log(chartDom);
            var myChart = ec.init(chartDom);
            var colors=["red","blue","green","black","orange","purple"]

            option = {
                title: {
                    text: '测试',
                },
                tooltip: {
                    trigger: 'axis',
                    axisPointer: { // 坐标轴指示器,坐标轴触发有效
                        type: 'shadow' // 默认为直线,可选为:'line' | 'shadow'
                    },
                    formatter: function(params) {
                        return params[0].name + '<br/>' +
                            params[0].seriesName + ' : ' + params[0].value + '<br/>' +
                            params[1].seriesName + ' : ' + (params[1].value + params[0].value);
                    }
                },
                legend: {
                    selectedMode: false,
                    data: ['Acutal', 'Forecast']
                },
                toolbox: {
                    show: true,
                    feature: {
                        mark: { show: true },
                        dataView: { show: true, readOnly: false },
                        restore: { show: true },
                        saveAsImage: { show: true }
                    }
                },
                calculable: true,
                xAxis: [{
                    type: 'category',
                    data: ['top1', 'top2', 'top3', 'top4', 'top5', 'top6'],
                    splitLine:false
                    //data:[]
                },{
                    type: 'category',
                    show:false,
                    boundaryGap : false,
                    data: ['Cosco', 'CMA', 'APL', 'OOCL', 'Wanhai', 'Zim',"333"],
                    splitLine:false
                }],
                yAxis: [{
                        type: 'value',
                        boundaryGap: [0, 0.1],
                        splitLine:false
                    },
                    {
                        type: 'value',
                        name: '温度',
                        axisLabel: {
                            formatter: '{value} %'
                        },
                        splitLine:false
                    }
                ],
                series: [{
                        name: 'Acutal',
                        type: 'bar',
                        //barGap:'10%',
                        barCategoryGap: '0%',
                        itemStyle: {
                            normal: {
                                color: function(obj){
                                	if(obj.dataIndex>=0){
                                		return colors[obj.dataIndex];
                                	}
                                },
                                barBorderColor: 'tomato',
                                barBorderWidth: 1,
                                barBorderRadius: 2,
                                label: {
                                    show: true,
                                    position: 'insideTop'
                                }
                            }
                        },
                        data: [300, 200, 180, 150, 120, 50]
                    },
                    {
                        name: 'Forecast',
                        type: 'line',
                        xAxisIndex: 1,
                        yAxisIndex: 1,
                        data: [0, 30,50, 68, 83, 95,100 ]
                    }

                ]
            };


            myChart.setOption(option);
        })
    }
    </script>
</head>

<body>
    <div id="dv" style="width:900px;height: 600px"></div>
</body>

</html>


posted @ 2017-10-28 19:23  戈壁追风人  阅读(2926)  评论(0编辑  收藏  举报