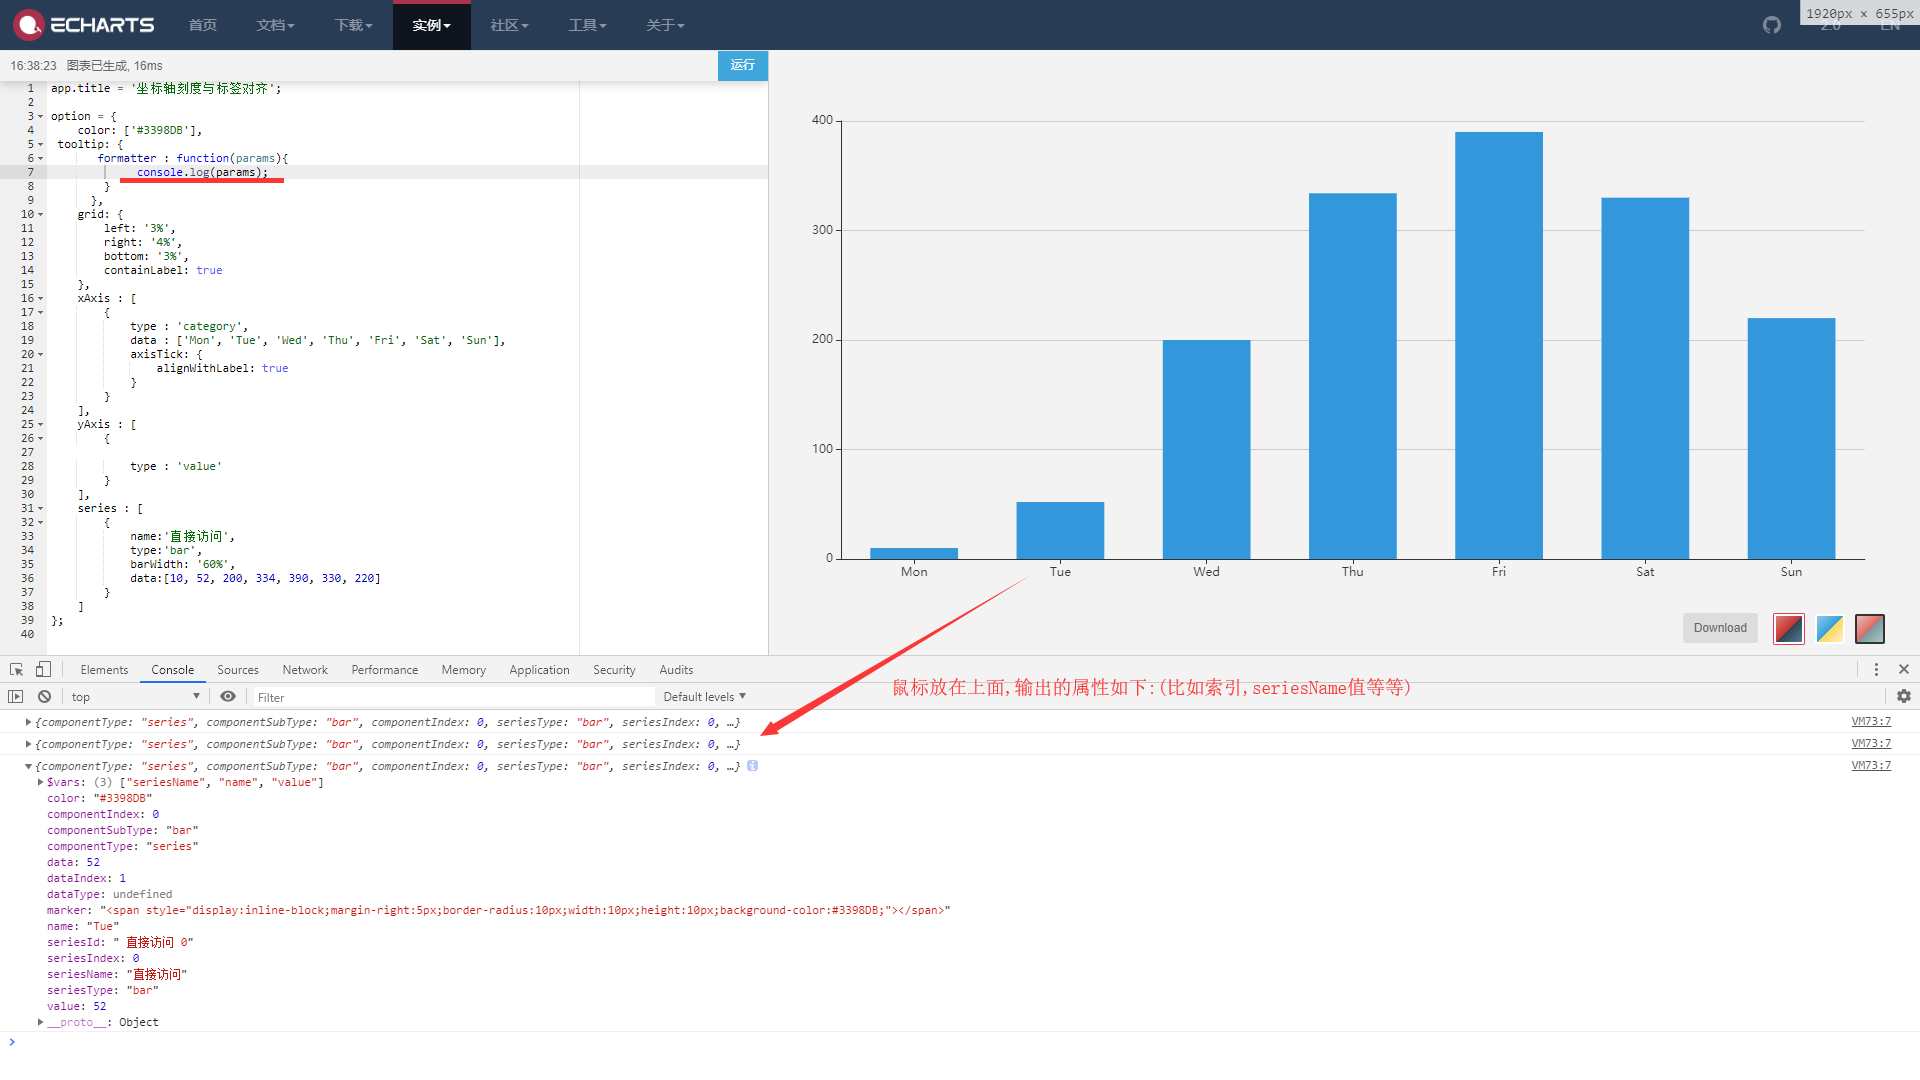
一、柱状图讲解
一、柱状图
先了解
app.title = '坐标轴刻度与标签对齐';

option = {

    color: ['#3398DB'], //柱子颜色
    tooltip: {
        formatter: function (params) {
            console.log(params); //打印参数
            console.log(params.dataIndex); //获取第几个柱子
        }
    },
    xAxis: [ //x轴,数组对象,其下至少有一个对象
        {
            type: 'category',
            data: ['Mon', 'Tue', 'Wed', 'Thu', 'Fri', 'Sat', 'Sun'],
            axisTick: {
                alignWithLabel: true
            }
        }
    ],
    yAxis: [ //y轴,数组对象,其下可以有空对象
        {

            type: 'value'
        }
    ],
    series: [ //驱动图表生成的数据内容数组,其下至少有一个对象
        {
            name: '直接访问',
            type: 'bar',
            barWidth: '60%',
            data: [10, 52, 200, 334, 390, 330, 220]
        }
    ]
};

查看上面的图,这里实现不同的柱子显示不同的 tooltip适用formatter 属性
二、雷达图
                    option = {
                        title: {
                            text: '基础雷达图'
                        },
                        tooltip: {},
                        radar: {
                            indicator: [
                                { name: '苹果', max: 6500 },
                                { name: '西瓜', max: 16000 },
                                { name: '葡萄', max: 30000 },
                                { name: '哈密瓜', max: 38000 },
                                { name: '香蕉', max: 52000 },
                                { name: '桃', max: 25000 }
                            ]
                        },
                        series: [{
                            type: 'radar',
                            data: [
                                {
                                    value: [4300, 10000, 28000, 35000, 50000, 19000],
                                    name: '水果',
                                    //这里的配置显示数值
                                    label: {
                                        normal: {
                                            show: true,
                                            formatter: function (params) {
                                                return params.value;
                                            }
                                        }
                                    }
                                }
                            ]
                        }]
                    };
点到为止


