傅立叶系数的对称性
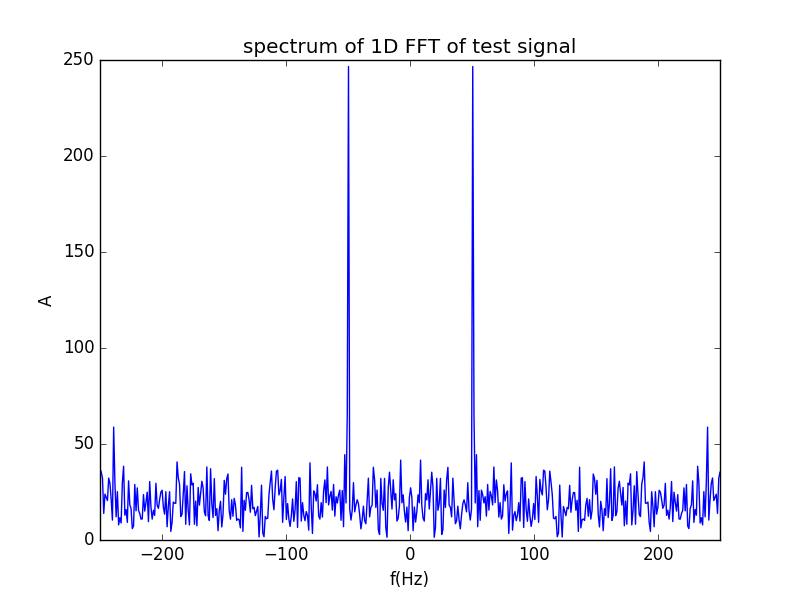
在对信号进行傅立叶变换时得到的频谱,会有频率为负数的部分,对于一维FFT如果画出正负频率的频谱,并以幅度的绝对值表示,可以发现在频谱上正负频率是对称分布的,这是为什么呢?对于二维傅立叶变换也有相同的规律吗?
- 对于一维傅立叶变换,系数是对称的,如果从数学理论上做些分析,可以发现对于任意信号g(t), t in [a,b]的傅立叶变换,在某一个频率f的傅立叶系数如下:
\(G(f)=\int_a^b g(t)e^{-i 2\pi ft}dt=\int_a^b ft cos(2\pi f(t)dt)-i\int_a^b g(t)sin(2\pi ft)dt=A-iB\)
而对于频率为-f的傅立叶系数,同样的步骤有:
\(G(-f)=A+iB\)
也即,正负频率对应的傅立叶系数是复共轭的,所以正负频率的强度(傅立叶系数的模)是对称的:
\(G(-f)=G(f)^* \to |G(-f)|=|G(f)|\)
注:加星号代表对复数取共轭。
如下python代码模拟的结果。
import numpy
import pylab
t=numpy.linspace(0,1,500)
Fs=1/(t[2]-t[1])
sig1=numpy.sin(2*3.1415*50*t)
# add random signal into the real signal
sig_test=sig1+numpy.random.randn(sig1.shape[0])
sig_fft_comp=numpy.fft.fft(sig_test)
sig_fft_abs=numpy.abs(sig_fft_comp)
f=numpy.linspace(-Fs/2,Fs/2,len(sig_fft_abs))
f_len=len(f)
# reorder the fft data in the correct frequency order, with both positive and negative order
sig_fft_order=numpy.concatenate([sig_fft_abs[f_len/2:f_len],sig_fft_abs[0:f_len/2]])
plt.figure()
plt.plot(f,sig_fft_order)
plt.xlabel('f(Hz)')
plt.ylabel('A')
plt.title('spectrum of 1D FFT of test signal')
plt.xlim([f[0],f[f_len-1]])
plt.show()

- 下面我们看看二维傅立叶系数的规律
首先从数学理论上做些分析,对于二维数据p(x,y), x in [a,b], y in [c,d], 的傅立叶变换,其傅立叶系数为:
\(P(fx,fy)=\int_a^b \int_c^d p(x,y)e^{-i 2\pi (f_x x+f_y y)}dxdy=\int_a^b \int_c^d p(x,y)cos( 2\pi (f_x x+f_y y))dxdy - i\int_a^b \int_c^d p(x,y)sin(2\pi (f_x x+f_y y))dxdy\)
类似的,可以得到:
\(P(fx,fy)=P(-fx,-fy)^* \to |P(-fx,-fy)|=|P(fx,fy)|, |P(fx,-fy)|=|P(-fx,fy)|\)
也即,二维傅立叶变换的系数(强度)是中心对称的,并不是轴对称的分布:
\(|P(fx,-fy)| \neq |P(fx,fy)|\)
利用python模拟的结果如下:
from scipy import fftpack, ndimage
import matplotlib.pyplot as plt
import numpy
import scipy
# set interactive figure condition
plt.ion()
pi=numpy.pi
image = ndimage.imread('image2.jpg', flatten=True)
# flatten=True gives a greyscale image
fft2 = fftpack.fft2(image)
fft2_abs=abs(fft2)
# this will shift the fft_abs as low f centered data that agrees with our frequency array
fft2_abs_shift=numpy.fft.fftshift(fft2_abs)
# generate relative fx, fy array whose frequency do not represent the real frequency
ny=numpy.linspace(-1,1,fft2_abs.shape[1])
mx=numpy.linspace(-2,2,fft2_abs.shape[0])
# plot the 2D fft spectrum
plt.figure()
plt.pcolormesh(ny,mx,numpy.log(fft2_abs_shift),cmap='hsv')
plt.xlabel('relative fy')
plt.ylabel('relative fx')
plt.title('2D fft spectrum')
plt.colorbar()
plt.show()

结果如上,左图是提取原始二维矩阵数据的一张照片,右图是其对应的二维傅立叶变换频谱图,可以清楚地看到在频谱图上,频谱强度是中心对称而非针对正负频率的轴对称分布。


