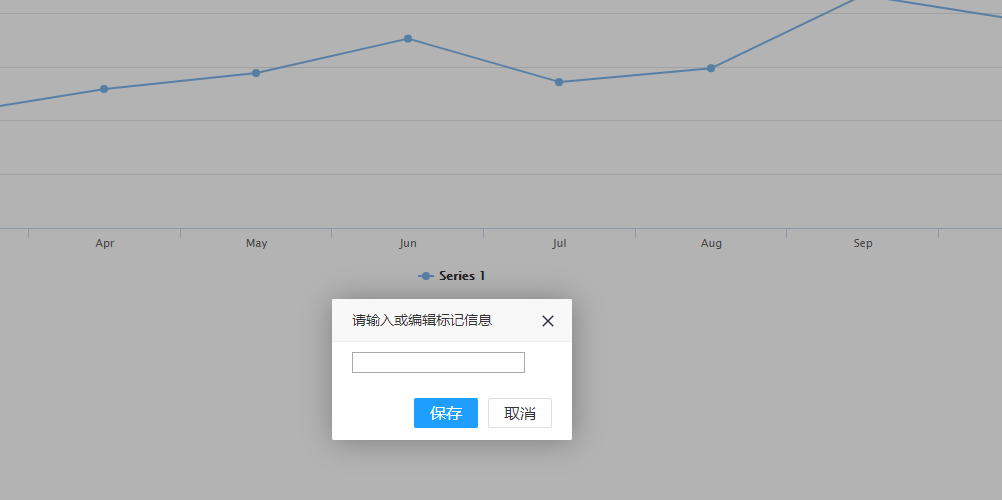
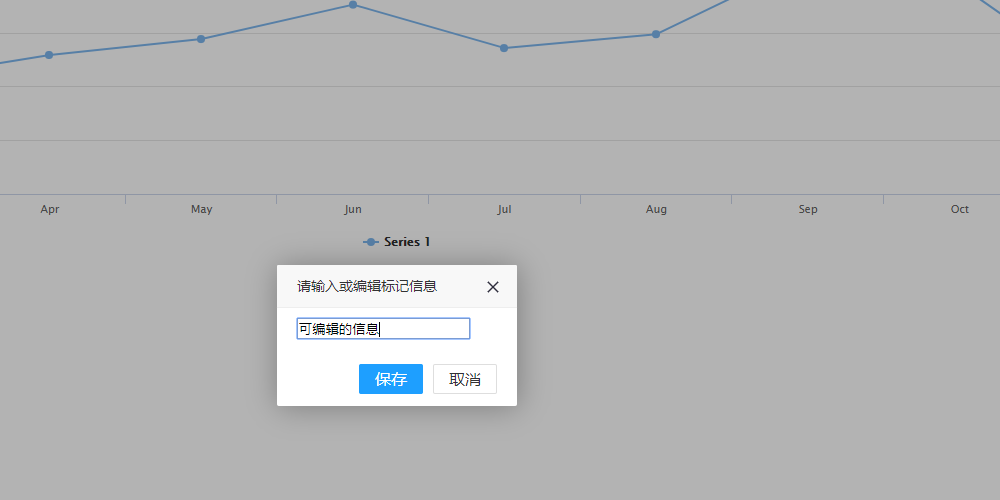
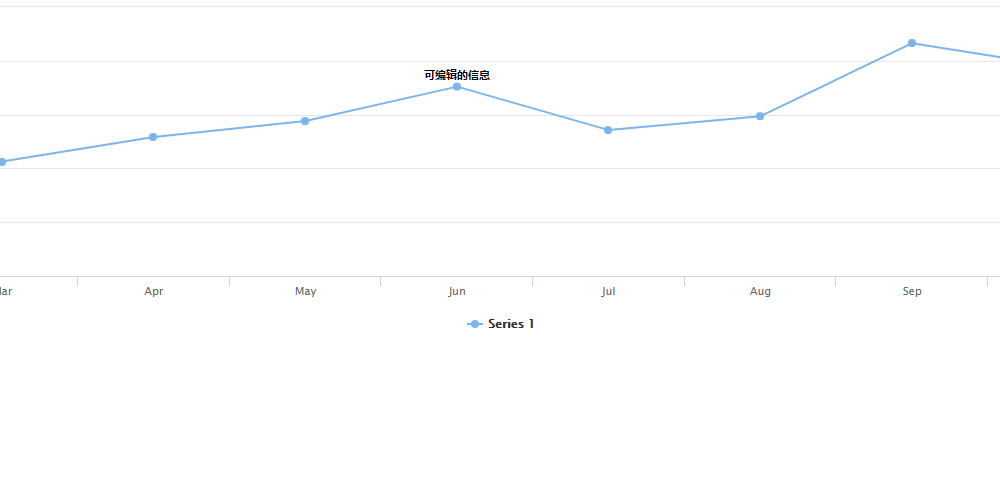
前言: 公司项目最近因台风导致部分数据丢失,有了个新需求:在图形上添加标志提醒用户,数据丢失不是我的锅,是台风的锅.
code:
<!DOCTYPE html>
<html lang="en">
<head>
<meta charset="UTF-8">
<meta name="viewport" content="width=device-width, initial-scale=1.0">
<meta http-equiv="X-UA-Compatible" content="ie=edge">
<title>highcharts配合layui弹出层实现图形数据列标记的增删改查</title>
</head>
<body>
<div id="container"></div>
</body>
<script src="https://cdn.hcharts.cn/highcharts/highcharts.js"></script>
<script src="https://code.jquery.com/jquery-3.3.1.js" integrity="sha256-2Kok7MbOyxpgUVvAk/HJ2jigOSYS2auK4Pfzbm7uH60=" crossorigin="anonymous"></script>
<script src="./layer/layer.js"></script>
<script>
var data = [29.9, 71.5, 106.4, 129.2, 144.0, 176.0, 135.6, 148.5, 216.4, 194.1, 95.6, 54.4];
var lineData = [];
$.each(data,function(i,v){
lineData.push({
y: v,
dataLabels:{
enabled: true,
allowOverlap: true,
crop:false,
overflow:'none',
formatter:function(){
return '';
},
shadow:false
},
events: {
click: function () {
var x = this.x,
z = this.category,
y = this.y;
layer.open({
type: 1,
title:"请输入或编辑标记信息",
content: '<input type="text" class="layuiInp" autofocus style="margin:10px 20px;">',
btn: ['保存', '取消'],
yes: function (index, layero) {
updataLine(x, y,z, $('.layuiInp').val())
layer.closeAll();
},
btn2: function(){
layer.closeAll();
}
});
}
}
})
})
var chart = Highcharts.chart('container', {
xAxis: {
categories: ['Jan', 'Feb', 'Mar', 'Apr', 'May', 'Jun', 'Jul', 'Aug', 'Sep', 'Oct', 'Nov', 'Dec']
},
series: [{
data:lineData
}]
});
function updataLine(x,y,z,value){
chart.series[0].data[x].update({
dataLabels: {
enabled: true,
allowOverlap: true,
crop: false,
overflow:'none',
formatter: function () {
return String(value);
},
shadow: false
},
});
}
</script>
</html>
效果图: