echarts_部分图表配置简介_横向柱状图

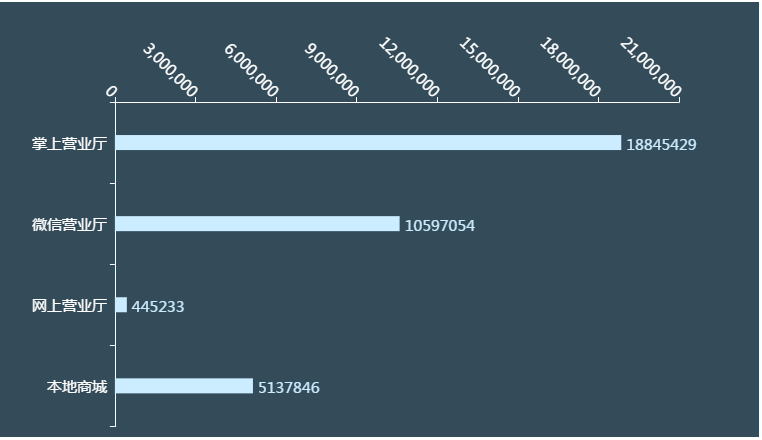
横向柱状图主要配置x位置x轴类型y轴类型(轴的类型分两种 1.category(类别)2.value(值)),代码简单(里面有注释)效果如下:

  1 var myChart = echarts.init(document.getElementById('thisId'));
  2             /*指定图表的配置项和数据*/
  3             option = {
  4                     textStyle:{
  5                         color:'#fff',
  6                         fontSize:'16'
  7                      },
  8                     title: {
  9                         textStyle:{
 10                             color:'#fff',
 11                             
 12                          },
 13                          left:'50%',
 14                         text: '',
 15                        /* subtext: '数据来自网络'*/
 16                     },
 17                     tooltip: {
 18                         trigger: 'axis',
 19                         axisPointer: {
 20                             type: 'shadow'
 21                         }
 22                     },
 23                     legend: {
 24 
 25                         textStyle:{
 26                             color:'#fff',
 27                          },
 28                        /* data: [titleName],*/
 29                     },
 30                     grid: {//设置图表位置
 31                         left: '3%',
 32                         right: '4%',
 33                         bottom: '3%',
 34                         containLabel: true
 35                     },
 36                     xAxis: {
 37                         color:'#fff',
 38                         splitLine : {//去掉网格线
 39                             show : false
 40                         },
 41                         position: 'top',//X轴位置
 42                         type: 'value',
 43                         boundaryGap: [0, 0.01],
 44                         axisLabel : {//坐标轴刻度标签的相关设置
 45                             rotate:'45',//坐标轴文字旋转角度
 46                             show : true,
 47                             textStyle : {
 48                                 color : '#FFF',
 49                                 align : 'right',
 50                                 fontSize: 15
 51                             }
 52                         },
 53                         
 54                         axisLine : {
 55                             
 56                             lineStyle : {
 57                                 color : '#FFF'
 58                             }
 59                         },
 60                         axisTick : {
 61                             lineStyle : {
 62                                 color : '#FFF'
 63                             }
 64                         },
 65                     },
 66                     yAxis: {
 67                         
 68                         type: 'category',//轴的类型分两种 1.category(类别)2.value(值)
 69                         data: /*da*/[ '本地商城','网上营业厅',  '微信营业厅', '掌上营业厅' ],
 70                         axisLabel : {
 71                             show : true,
 72                             textStyle : {
 73                                 color : '#FFF',
 74                                 align : 'right',
 75                                 fontSize: 15    /*文字大小*/
 76                             }
 77                         },
 78                         axisLine : {
 79                             lineStyle : {
 80                                 color : '#fff'//轴的颜色
 81                             }
 82                         },
 83                         axisTick : {
 84                             lineStyle : {
 85                                 color : '#FFF'//轴上点的颜色
 86                             }
 87                         },
 88 
 89                     },
 90                     series: [
 91                         {
 92                             name: channelArr,
 93                             type: 'bar',
 94                             data: /*aa*/indexArr,/*请求回来的数据数组*/
 95                             
 96                             label : {
 97                                 normal : {
 98                                     show : true,//显示数字
 99                                     position : 'right'
100                                 }
101                             },
102                             
103                             barWidth : 15,//柱子宽度
104                             itemStyle : {
105                                 normal : {
106                                     color:'#ccecff',//柱状的颜色
107                                     label : {
108                                           textStyle : {
109                                               fontSize : '15',//柱状上的显示的文字
110                                               color:'#ccecff'
111                                           }
112                                       }
113                                 }
114                             },
115 
116                         }
117 
118                     ]
119                 };
120             // 使用刚指定的配置项和数据显示图表。
121             myChart.setOption(option);


posted @ 2017-08-03 16:08  孙大阳  阅读(18335)  评论(1编辑  收藏  举报