会员
周边
捐助
新闻
博问
闪存
赞助商
所有博客
当前博客
我的博客
我的园子
账号设置
简洁模式
...
退出登录
注册
登录
Phd Way-深度学习之三维重建
吾亦无他,唯手熟尔
博客园
首页
新随笔
联系
订阅
管理
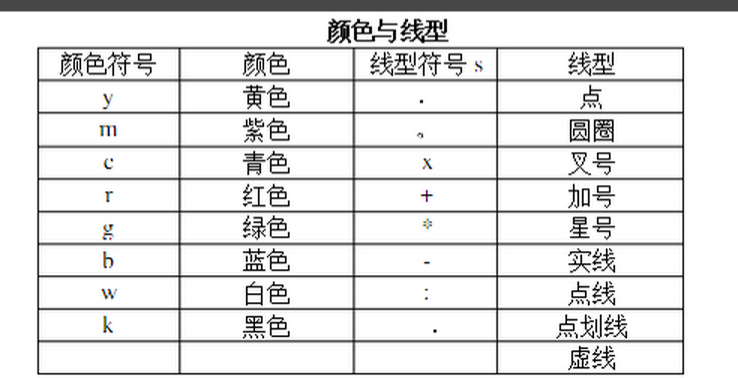
matlab里plot设置线形和颜色
plot(x,y,'r--')% r为颜色,--为线形
posted on
2016-08-17 22:35
chamie
阅读(
6137
) 评论(
0
)
编辑
收藏
举报
会员力量,点亮园子希望
刷新页面
返回顶部