一、收集nginx日志
1.部署nginx
[root@linux-host6 ~]# yum install gcc gcc-c++ automake pcre pcre-devel zlip zlib-devel openssl openssl-devel

[root@linux-host6 ~]# cd /usr/local/src/

[root@linux-host6 src]# wget http://nginx.org/download/nginx-1.10.3.tar.gz

[root@linux-host6 src]# tar xvf  nginx-1.10.3.tar.gz

[root@linux-host6 src]# cd nginx-1.10.3

[root@linux-host6 nginx-1.10.3]# ./configure  --prefix=/usr/local/nginx-1.10.3

[root@linux-host6 nginx-1.10.3]# make && make install

[root@linux-host6 nginx-1.10.3]# ln -sv /usr/local/nginx-1.10.3 /usr/local/nginx

‘/usr/local/nginx’ -> ‘/usr/local/nginx-1.10.3’
2.编辑配置文件并准备web页面:
[root@linux-host6 nginx-1.10.3]# cd /usr/local/nginx

[root@linux-host6 nginx]# vim conf/nginx.conf

        location /web {

            root   html;

            index  index.html index.htm;
       }

[root@linux-host6 nginx]# mkdir  /usr/local/nginx/html/web

[root@linux-host6 nginx]# echo " Nginx WebPage! " > /usr/local/nginx/html/web/index.html
3.测试nginx配置:
/usr/local/nginx/sbin/nginx  -t #测试配置文件语法

/usr/local/nginx/sbin/nginx  #启动服务


/usr/local/nginx/sbin/nginx  -s reload #重读配置文件
4.启动nginx并验证:
[root@linux-host6 nginx]# /usr/local/nginx/sbin/nginx  -t

nginx: the configuration file /usr/local/nginx-1.10.3/conf/nginx.conf syntax is ok

nginx: configuration file /usr/local/nginx-1.10.3/conf/nginx.conf test is successful

[root@linux-host6 nginx]# /usr/local/nginx/sbin/nginx

[root@linux-host6 nginx]# lsof  -i:80

COMMAND   PID   USER   FD   TYPE DEVICE SIZE/OFF NODE NAME

nginx   17719   root    6u  IPv4  90721      0t0  TCP *:http (LISTEN)


nginx   17720 nobody    6u  IPv4  90721      0t0  TCP *:http (LISTEN)
访问nginx页面:
5.将nginx日志转换为json格式:
[root@linux-host6 nginx]# vim  conf/nginx.conf

log_format access_json '{"@timestamp":"$time_iso8601",'

        '"host":"$server_addr",'

        '"clientip":"$remote_addr",'

        '"size":$body_bytes_sent,'

        '"responsetime":$request_time,'

        '"upstreamtime":"$upstream_response_time",'

        '"upstreamhost":"$upstream_addr",'

        '"http_host":"$host",'

        '"url":"$uri",'

        '"domain":"$host",'

        '"xff":"$http_x_forwarded_for",'

        '"referer":"$http_referer",'

        '"status":"$status"}';

    access_log  /var/log/nginx/access.log  access_json;

[root@linux-host6 nginx]# mkdir /var/log/nginx

[root@linux-host6 nginx]# /usr/local/nginx/sbin/nginx  -t

nginx: the configuration file /usr/local/nginx-1.10.3/conf/nginx.conf syntax is ok

nginx: configuration file /usr/local/nginx-1.10.3/conf/nginx.conf test is successful
6.确认日志格式为json:
[root@linux-host6 nginx]# tail  /var/log/nginx/access.log   # 博主整理了一下,不然太长了
{
  "@timestamp":"2017-04-21T17:03:09+08:00",
  "host":"192.168.56.16",
  "clientip":"192.168.56.1",
  "size":0,
  "responsetime":0.000,
  "upstreamtime":"-",
  "upstreamhost":"-",
  "http_host":"192.168.56.16",
  "url":"/web/index.html",
  "domain":"192.168.56.16",
  "xff":"-",
  "referer":"-",
  "status":"304"
}
7.配置logstash收集nginx访问日志:
[root@linux-host6 conf.d]# vim nginx.conf
input {
  file {
    path => "/var/log/nginx/access.log"
    start_position => "end"
    type => "nginx-accesslog"
    codec => json
  }
}


output {
  if [type] == "nginx-accesslog" {
    elasticsearch {
      hosts => ["192.168.56.11:9200"]
      index => "logstash-nginx-accesslog-5616-%{+YYYY.MM.dd}"
  }}
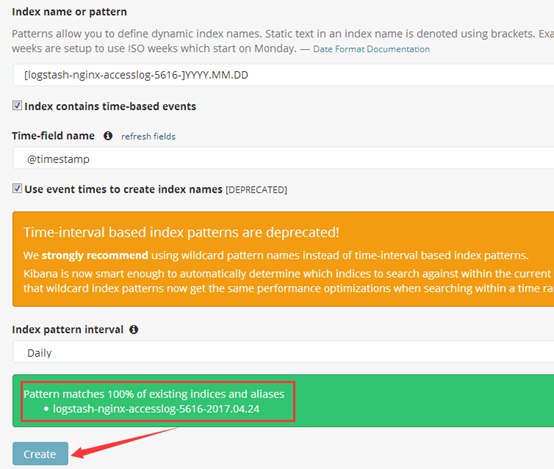
8.kibana界面添加索引:
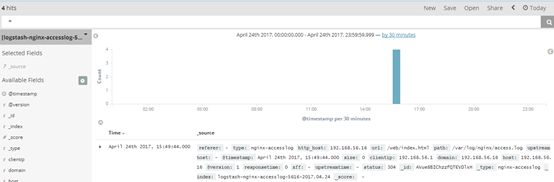
9.kibana界面验证数据:
二、收集TCP/UDP日志
通过logstash的tcp/udp插件收集日志,通常用于在向elasticsearch日志补录丢失的部分日志,可以将丢失的日志通过一个TCP端口直接写入到elasticsearch服务器。
1.logstash配置文件,先进行收集测试:
[root@linux-host6 ~]# cat /etc/logstash/conf.d/tcp.conf
input {
  tcp {
    port => 9889
    type => "tcplog"
    mode => "server"
  }
}


output {
  stdout {
    codec => rubydebug
  }
}
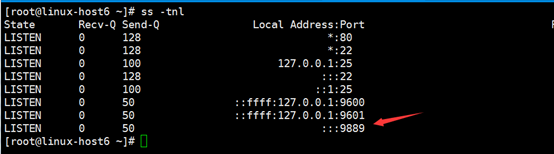
2.验证端口启动成功:
[root@linux-host6 src]# /usr/share/logstash/bin/logstash -f /etc/logstash/conf.d/tcp.conf
在其他服务器安装nc命令:
NetCat简称nc,在网络工具中有“瑞士军刀”美誉,其功能实用,是一个简单、可靠的网络工具,可通过TCP或UDP协议传输读写数据,另外还具有很多其他功能。
[root@linux-host1 ~]# yum instll nc –y
[root@linux-host1 ~]# echo "nc test" | nc 192.168.56.16 9889
3.验证logstash是否接收到数据:

4.通过nc命令发送一个文件:
[root@linux-host1 ~]# nc 192.168.56.16 9889 < /etc/passwd
5.logstash验证数据:
6.通过伪设备的方式发送消息:
在类Unix操作系统中,设备节点并不一定要对应物理设备。没有这种对应关系的设备是伪设备。操作系统运用了它们提供的多种功能,tcp只是dev下面众多伪设备当中的一种设备。
[root@linux-host1 ~]# echo "伪设备" > /dev/tcp/192.168.56.16/9889
7.logstash验证数据:

8.将输出改为elasticsearch:
[root@linux-host6 conf.d]# vim /etc/logstash/conf.d/tcp.conf
input {
  tcp {
    port => 9889
    type => "tcplog"
    mode => "server"
  }
}

output {
  elasticsearch {
    hosts => ["192.168.56.11:9200"]
    index =>  "logstash-tcplog-%{+YYYY.MM.dd}"
  }
}
[root@linux-host6 conf.d]# systemctl  restart logstash
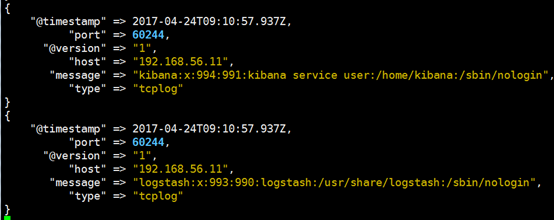
9.通过nc命令或伪设备输入日志:
[root@linux-host1 ~]# echo "伪设备1"  > /dev/tcp/192.168.56.16/9889
[root@linux-host1 ~]# echo "伪设备2"  > /dev/tcp/192.168.56.16/9889
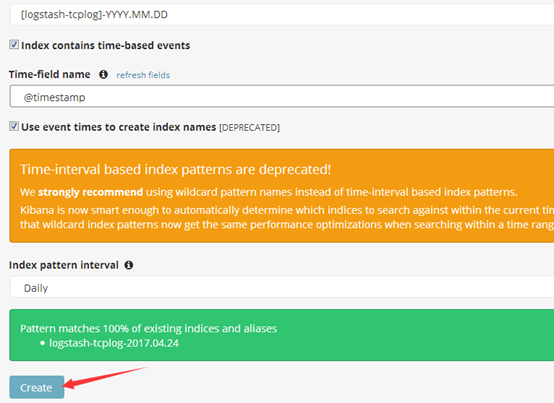
10.在kibana界面添加索引:
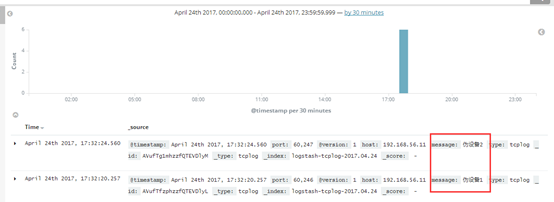
11.验证数据:
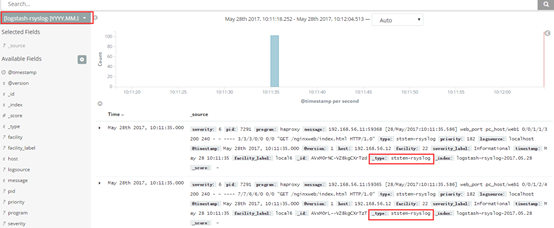
三、通过rsyslog收集haproxy日志。
在centos 6及之前的版本叫做syslog,centos 7开始叫做rsyslog,根据官方的介绍,rsyslog(2013年版本)可以达到每秒转发百万条日志的级别,官方网址:http://www.rsyslog.com/,确认系统安装的版本命令如下:
[root@linux-host1 ~]# yum list syslog
Installed  Packages      rsyslog.x86_64   7.4.7-12.el7
1.编译安装配置haproxy:
[root@linux-host2 ~]# cd /usr/local/src/
[root@linux-host2 src]# wget http://www.haproxy.org/download/1.7/src/haproxy-1.7.5.tar.gz
[root@linux-host2 src]# tar xvf  haproxy-1.7.5.tar.gz
[root@linux-host2 src]# cd haproxy-1.7.5
[root@linux-host2 src]# yum install gcc pcre pcre-devel openssl  openssl-devel -y [root@linux-host2 haproxy-1.7.5]#make TARGET=linux2628 USE_PCRE=1 USE_OPENSSL=1 USE_ZLIB=1  PREFIX=/usr/local/haproxy
[root@linux-host2 haproxy-1.7.5]#  make install PREFIX=/usr/local/haproxy
[root@linux-host2 haproxy-1.7.5]# /usr/local/haproxy/sbin/haproxy  -v #确认版本
HA-Proxy version 1.7.5 2017/04/03
Copyright 2000-2017 Willy Tarreau <willy@haproxy.org
准备启动脚步:
[root@linux-host2 haproxy-1.7.5]#  vim /usr/lib/systemd/system/haproxy.service
[Unit]
Description=HAProxy Load Balancer
After=syslog.target network.target

[Service]
EnvironmentFile=/etc/sysconfig/haproxy
ExecStart=/usr/sbin/haproxy-systemd-wrapper -f /etc/haproxy/haproxy.cfg -p /run/haproxy.pid $OPTIONS
ExecReload=/bin/kill -USR2 $MAINPID

[Install]
WantedBy=multi-user.target

[root@linux-host2 haproxy-1.7.5]# cp /usr/local/src/haproxy-1.7.5/haproxy-systemd-wrapper  /usr/sbin/
[root@linux-host2 haproxy-1.7.5]# cp /usr/local/src/haproxy-1.7.5/haproxy  /usr/sbin/

[root@linux-host2 haproxy-1.7.5]# vim /etc/sysconfig/haproxy #系统级配置文件
# Add extra options to the haproxy daemon here. This can be useful for
# specifying multiple configuration files with multiple -f options.
# See haproxy(1) for a complete list of options.
OPTIONS=""


[root@linux-host2 haproxy-1.7.5]# mkdir /etc/haproxy
[root@linux-host2 haproxy-1.7.5]# cat  /etc/haproxy/haproxy.cfg
global
maxconn 100000
chroot /usr/local/haproxy
uid 99
gid 99
daemon
nbproc 1
pidfile /usr/local/haproxy/run/haproxy.pid
log 127.0.0.1 local6 info

defaults
option http-keep-alive
option  forwardfor
maxconn 100000
mode http
timeout connect 300000ms
timeout client  300000ms
timeout server  300000ms

listen stats
 mode http
 bind 0.0.0.0:9999
 stats enable
 log global
 stats uri     /haproxy-status
 stats auth    haadmin:123456

#frontend web_port
frontend web_port
        bind 0.0.0.0:80
        mode http
        option httplog
        log global
        option  forwardfor
###################ACL Setting##########################
        acl pc          hdr_dom(host) -i www.elk.com
        acl mobile      hdr_dom(host) -i m.elk.com
###################USE ACL##############################
        use_backend     pc_host        if  pc
        use_backend     mobile_host    if  mobile
########################################################

backend pc_host
        mode    http
        option  httplog
        balance source
        server web1  192.168.56.11:80 check inter 2000 rise 3 fall 2 weight 1

backend mobile_host
        mode    http
        option  httplog
        balance source
        server web1  192.168.56.11:80 check inter 2000 rise 3 fall 2 weight 1
2.编辑rsyslog服务配置文件
$ModLoad imudp
$UDPServerRun 514

$ModLoad imtcp
$InputTCPServerRun 514  #去掉15/16/19/20行前面的注释

local6.*     @@192.168.56.11:5160   #最后面一行添加,local6对应haproxy配置文件定义的local级别
3.重新启动haproxy和rsyslog服务
[root@linux-host2 ~]# systemctl  enable  haproxy
[root@linux-host2 ~]# systemctl  restart haproxy
[root@linux-host2 ~]# systemctl  restart rsyslog
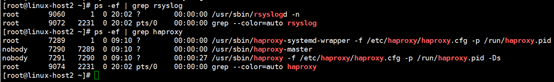
4.验证haproxy端口及服务
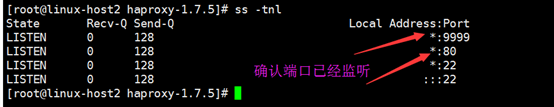
确认服务进程已经存在:
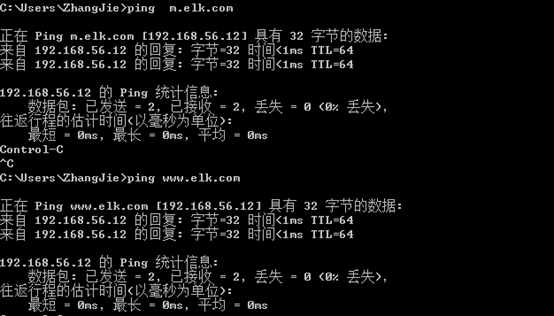
更改本地host文件
C:\Windows\System32\drivers\etc
192.168.56.12 www.elk.com
192.168.56.12 m.elk.com
测试域名及访问
启动后端web服务器的nginx:
[root@linux-host1 ~]# /usr/local/nginx/sbin/nginx
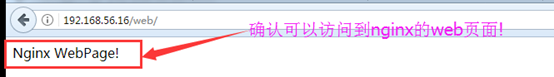
确认可以访问到nginx的web界面:


5.编辑logstash配置文件
配置logstash监听一个本地端口作为日志输入源,haproxy服务器的rsyslog输出IP和端口要等同于logstash服务器监听的IP:端口,本次的配置是在Host1上开启logstash,在Host2上收集haproxy的访问日志并转发至Host1服务器的logstash进行处理,logstash的配置文件如下:
[root@linux-host1 conf.d]# cat /etc/logstash/conf.d/rsyslog.conf
input{
      syslog {
        type => "system-rsyslog-haproxy5612"
        port => "5160"  #监听一个本地的端口
}}

output{
        stdout{
                codec => rubydebug
}}
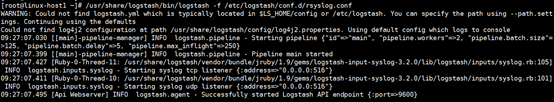
6.通过-f命令测试logstash
[root@linux-host1 conf.d]# /usr/share/logstash/bin/logstash -f /etc/logstash/conf.d/rsyslog.conf
7.web访问haproxy并验证数据
添加本地解析:
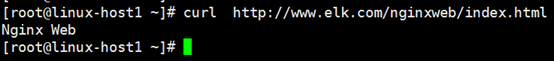
[root@linux-host1 ~]# tail –n2  /etc/hosts
192.168.56.12 www.elk.com
192.168.56.12 m.elk.com

[root@linux-host1 ~]# curl  http://www.elk.com/nginxweb/index.html
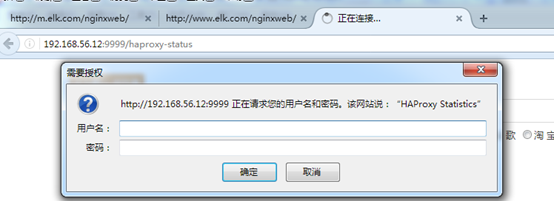
8.访问haproxy管理界面
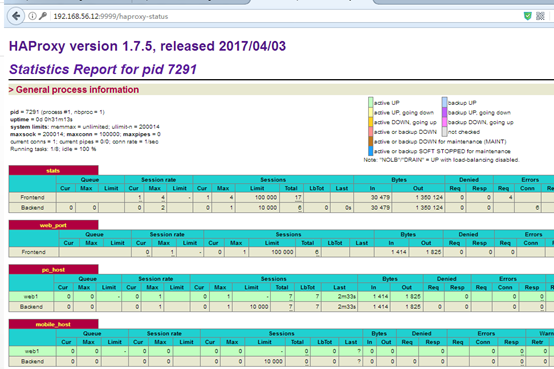
9.haproxy管理界面
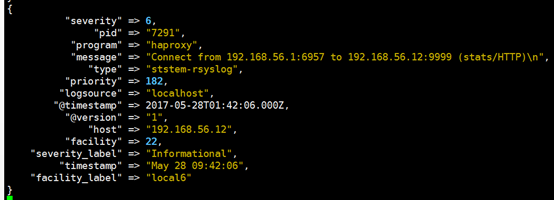
10.验证logstash输出
11.将输出改为elasticsearch
[root@linux-host1 conf.d]# cat  /etc/logstash/conf.d/rsyslog.conf
input{
      syslog {
        type => "ststem-rsyslog"
        port => "516"
}}

output{
  elasticsearch {
    hosts => ["192.168.56.11:9200"]
    index =>  "logstash-rsyslog-%{+YYYY.MM.dd}"
  }
}
[root@linux-host6 conf.d]# systemctl  restart logstash
12.web访问haproxy以生成新日志

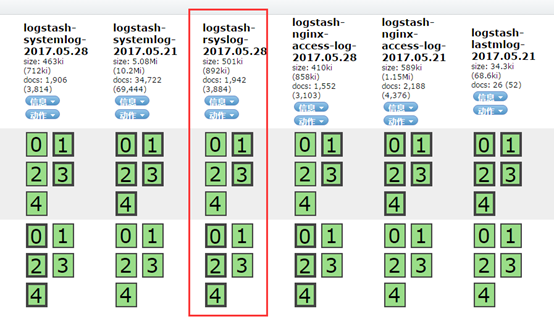
访问head插件以确认生成index:
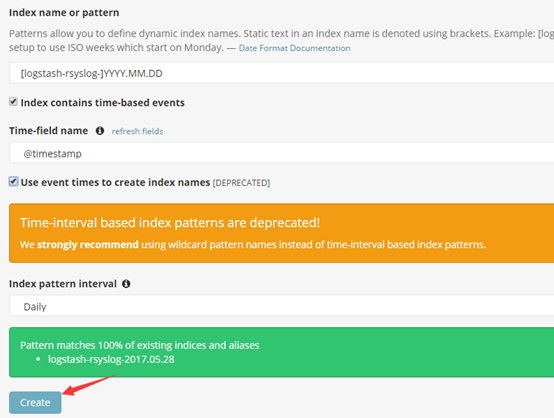
13.kibana界面添加索引
14.kibana验证数据