
Linux Power Management Debug
先从几份文档上总结一下经验。
Power Management, Debugging and Optimizations
《Power Management, Debugging and Optimizations》介绍了为什么要进行电源管理?电源管理相关的软硬件架构?如何去Debug,软件的和硬件的?如何去优化?
软件PM技术
Standby Power Management
Suspend/Resume
cpuidle(Dynamic clock switching/Dynamic power switching/Aggressive clock cutting)
Turn of as many devices as possible when not usedActive Power Management
Dynamic Frequency and Voltage Scaling(Multiple Operating Performance Point(V, F))
Adaptive voltage scaling
软件Debug技术
Prints
Spinloops
Persistent memory
sysfs and debugfs entries
cat /sys/devices/system/cpu/cpu0/cpufreq/*
cat /sys/devices/system/cpu/cpu0/cpuidle/state*/*
cat /debug/pm_debug/*
硬件Debug技术
Probing using Oscilloscope
Voltages/Clocks(on or off/frequency)Triggers in Oscilloscope can be very useful
Lauterbach
优化措施
GPIO Toggling
32KHz counter in wakeup domain
Turning off the LDOs
Just cut the clocks
Two many interrupts wakes the system
工具
powertop
PowerTOP is a Linux tool to diagnose issues with power consumption and power management.
In addition to being a diagnostic tool, PowerTOP also has an interactive mode where the user can experiment various power management settings for cases where the Linux distribution has not enabled these settings.
PowerTop的官网在:https://01.org/zh/powertop,帮住文档《POWERTOP User's Guide》。
powertop有两种使用模式:实时互动模式和离线模式。
通过powertop可以了解系统:那些应用活动频繁?cpuidle和cpufreq情况?设备状态?以及可优化的点?等系统PM状态。
实时模式
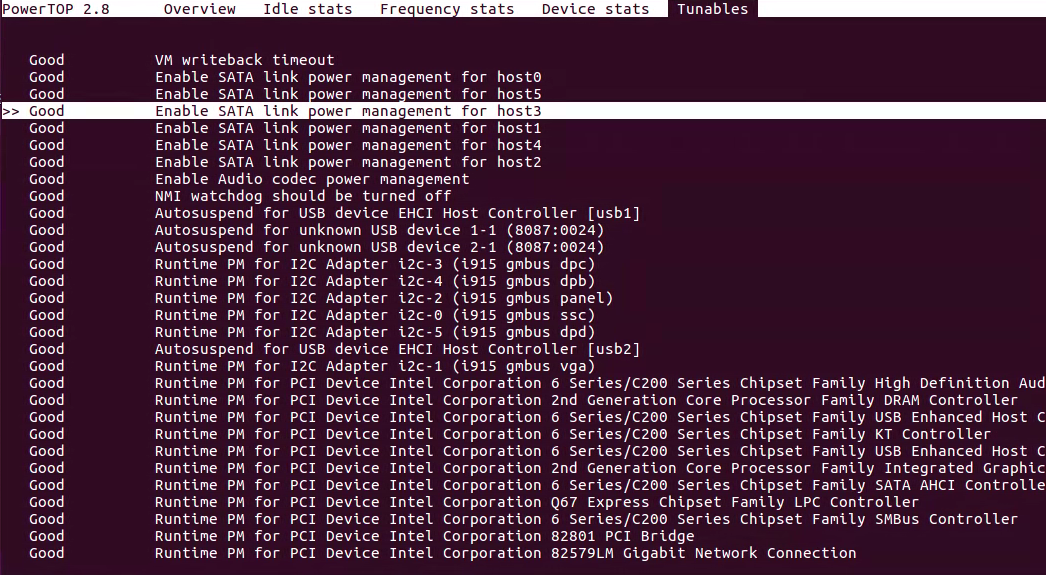
输入sudo powertop即可看到如下图的各种统计信息,可以使用Table进行切换。
在Tunables中可以按Enter,进行优化设置。
离线模式
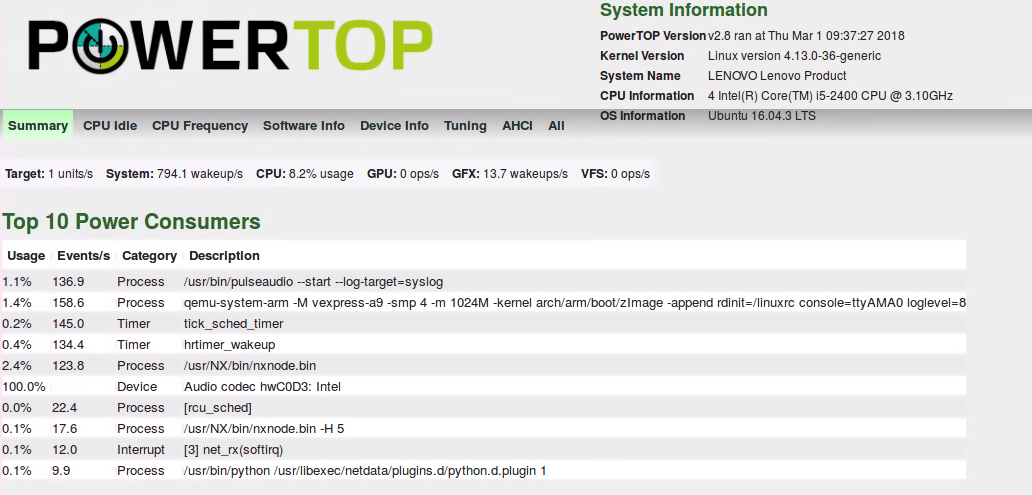
离线模式将测试结果保存到html或者csv文件中。
可读性相对于实时模式更强,信息也更丰富。
sudo powertop -c --debug --html=powerreport.html -i 2 -t 20 --auto-tune
powerdebug
是一款Linaro开发的工具,用于显示clock、regulator、Temperature sensor、GPIO相关信息。
Debugging embedded Linux power management
《Debugging embedded Linux power management》在简单介绍了PM架构之后,着重介绍了Debug工具方法及示例、内核的PM功能,典型PM问题。
PM Debug工具或方法
1.Disabling kernel features 通过关闭某些功能来确认问题点
Disable CONFIG_PM
Disable unnecessary drivers
Disable PM features, only enable a single PM feature at a time and attempt to reproduce the problem
2.Stress testing 压力测试
Scripts that do some PM related operations in a tight loop
Should be random enough so that the bug producing pattern is exexuted
3.Tracing Printk
Populate enough debug printks to the code being examined
4. GPIO/LED trace
Add control to some GPIO/LED signal from certain points in code
5.Buffered traces/statistics
Kernel tracepoints(Use kernelshark/pytimechart to analyze)
Dumped out with a console operation through debugfs
Kernel PM features
Suspend
Cpuidle
Cpufreq
Devfreq
Regulators
Clock framework
Some references
powertop
powerdebug
tracepoints
Info


 浙公网安备 33010602011771号