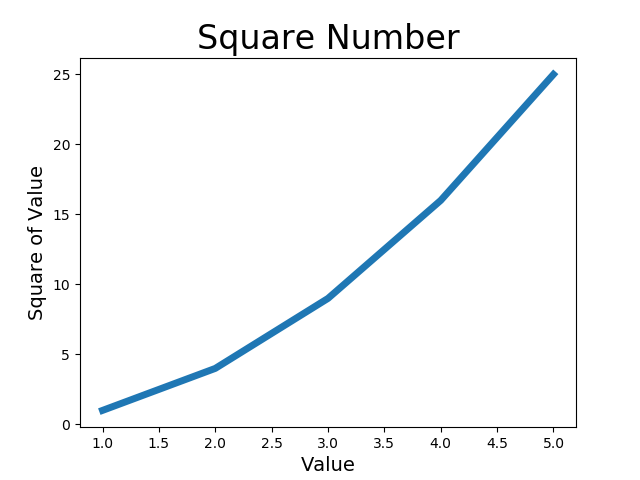
用matplotlib绘制简单的折线
如图:
import matplotlib.pyplot as plt
//引入matplotlib.pylot,用plt来替代
input_value = [1,2,3,4,5]
//设置横坐标数值
squares = [1,4,9,16,25]
//设置纵坐标数值
plt.plot(input_value,squares,linewidth=5)
//绘制图像(输入址,输出值,线宽)
plt.title("Square Number",fontsize=24)
//设置图像title
plt.xlabel("Value",fontsize=14)
//设置横坐标的名称,文字大小
plt.ylabel("Square of Value",fontsize=14)
//同上
plt.show()
//显示图片
posted on 2018-05-23 21:24 没有感情的程序员Ramos 阅读(122) 评论(0) 编辑 收藏 举报

