


debug kibana in chrome
kibana5.6.5版本
在kibana根目录运行命令:NODE_OPTIONS='--inspect --debug' npm start
也可以尝试命令:NODE_OPTIONS="--debug-brk --inspect' npm start
npm start 可替换为 ./bin/kibana 或 ${project_dir}/src/cli
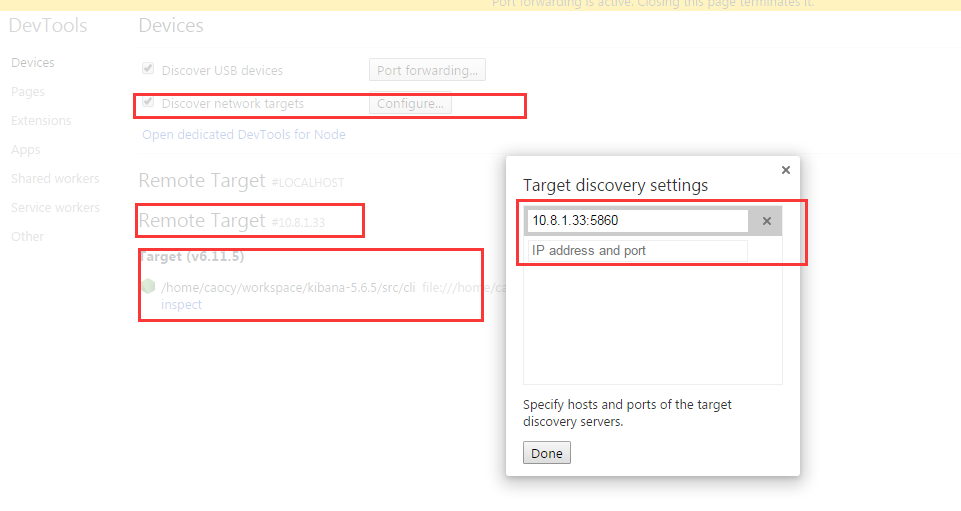
最后一个端口为5860的url
下面是命令执行后的日志:


caocy@ubuntu1:~/workspace/kibana-5.6.5$ NODE_OPTIONS='--inspect --debug' npm start

> kibana@5.6.5 start /home/caocy/workspace/kibana-5.6.5
> sh ./bin/kibana --dev

Debugger listening on port 9229.
Warning: This is an experimental feature and could change at any time.
To start debugging, open the following URL in Chrome:
    chrome-devtools://devtools/remote/serve_file/@60cd6e859b9f557d2312f5bf532f6aec5f284980/inspector.html?experiments=true&v8only=true&ws=127.0.0.1:9229/32809f53-3135-4523-9a5c-e5d36770bba0
 watching for changes  (407 files)
Debugger listening on port 5859.
Warning: This is an experimental feature and could change at any time.
To start debugging, open the following URL in Chrome:
    chrome-devtools://devtools/remote/serve_file/@60cd6e859b9f557d2312f5bf532f6aec5f284980/inspector.html?experiments=true&v8only=true&ws=127.0.0.1:5859/7877c417-38a6-470c-9b2e-77428acff5bf
Debugger listening on port 5860.
Warning: This is an experimental feature and could change at any time.
To start debugging, open the following URL in Chrome:
    chrome-devtools://devtools/remote/serve_file/@60cd6e859b9f557d2312f5bf532f6aec5f284980/inspector.html?experiments=true&v8only=true&ws=127.0.0.1:5860/1b36300a-30dd-4909-96f1-750c3fb8f7eb
  log   [04:08:49.225] [info][listening] basePath Proxy running at https://0.0.0.0:5701/dhe
optmzr    log   [04:08:53.402] [info][status][ui settings] Status changed from uninitialized to disabled - uiSettings.enabled config is set to `false`
optmzr    log   [04:08:54.713] [info][optimize] Lazy optimization of bundles for kibana, stateSessionStorageRedirect, timelion, sense-tests and status_page ready
server    log   [04:08:54.747] [info][optimize] Waiting for optimizer completion
optmzr    log   [04:08:54.771] [info][optimize] Lazy optimization started
optmzr    log   [04:08:54.801] [info] Plugin initialization disabled.
server    log   [04:08:54.885] [info][status][plugin:kibana@5.6.5] Status changed from uninitialized to green - Ready
server    log   [04:08:55.139] [info][status][plugin:elasticsearch@5.6.5] Status changed from uninitialized to yellow - Waiting for Elasticsearch
server    log   [04:08:55.220] [info][status][plugin:console@5.6.5] Status changed from uninitialized to green - Ready
server    log   [04:08:55.294] [info][status][plugin:metrics@5.6.5] Status changed from uninitialized to green - Ready
server    log   [04:08:55.341] [info][status][plugin:elasticsearch@5.6.5] Status changed from yellow to green - Kibana index ready
server    log   [04:08:55.871] [info][status][plugin:timelion@5.6.5] Status changed from uninitialized to green - Ready
server    log   [04:08:55.880] [info][listening] Server running at https://0.0.0.0:5603
server    log   [04:08:55.883] [info][status][ui settings] Status changed from uninitialized to green - Ready
optmzr    log   [04:09:49.859] [info][optimize] Lazy optimization success in 55.08 seconds
Debugging Node.js with Chrome DevTools:
Support for Node.js debuggability landed in Node.js in 2016. Here’s how to get up and running. (Post updated Jan 2018)
1. Download and install the current version of node. (v6.3.0+ required)
2. Run node with the --inspect flag:
▸ node --inspect index.js
# Break on the first statement of the script with --inspect-brk
▸ node --inspect-brk index.js
(In Node 6, you have to use --inspect --debug-brk for this inspect & pseudo-breakpoint combo.)
Next, you used to open the big chrome-devtools:// URL it spits out, but don’t. Now there’s a better way…
3. Open about:inspect in Chrome
It’ll redirect you to chrome://inspect quickly and you’ll see something like:
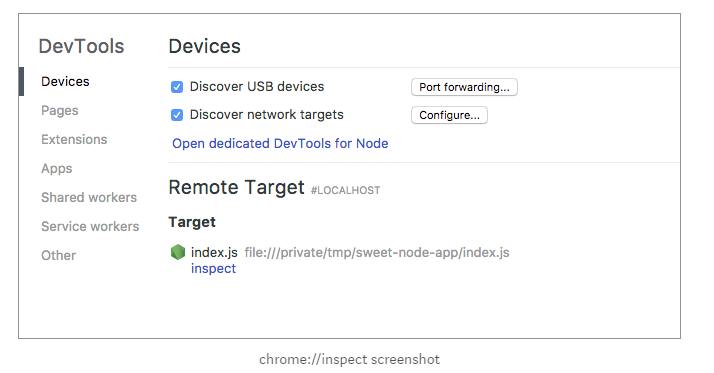
set targets:
4. Click the Open dedicated DevTools for Node link.
You’ll get a popup window for debugging your node session.
But better than that, when you kill and restart node, the window will automatically reconnect to it. 🔁🔁💥
(Btw: the inspect link beneath the specific target will only apply for that session of node and won’t reconnect.)
点击connection,连接IP:5860,切换到sources
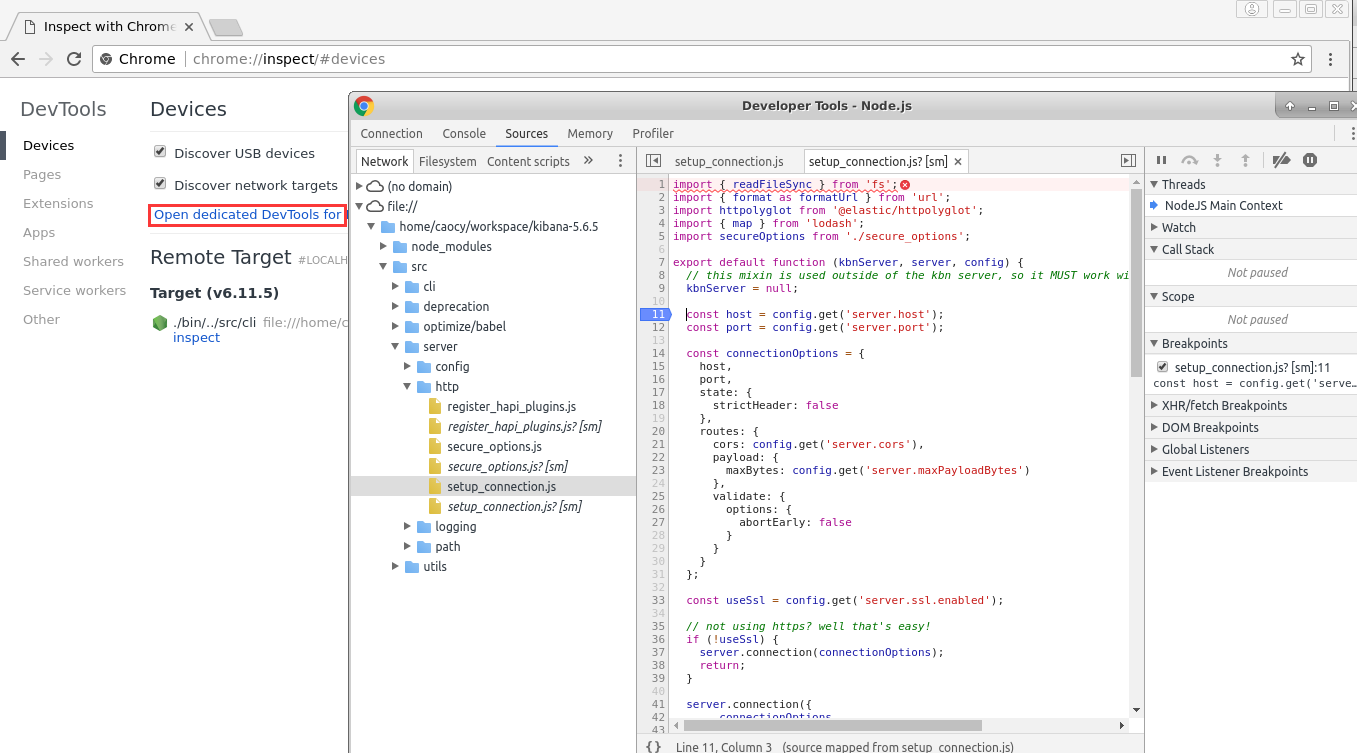
In DevTools, now connected to Node, you’ll have all the Chrome DevTools features you’re used to:
- Complete breakpoint debugging, stepping w/ blackboxing
- Source maps for transpiled code
- LiveEdit: JavaScript hot-swap evaluation w/ V8
- Console evaluation with ES6 feature/object support and custom object formatting
- Sampling JavaScript profiler w/ flamechart
- Heap snapshot inspection, heap allocation timeline, allocation profiling
- Asynchronous stacks for native promises
To see this in action, here’s my demo during the 2017 Node Summit:
Lastly, there is now official documentation on debugging Node with the new protocol: https://nodejs.org/en/docs/inspector/
