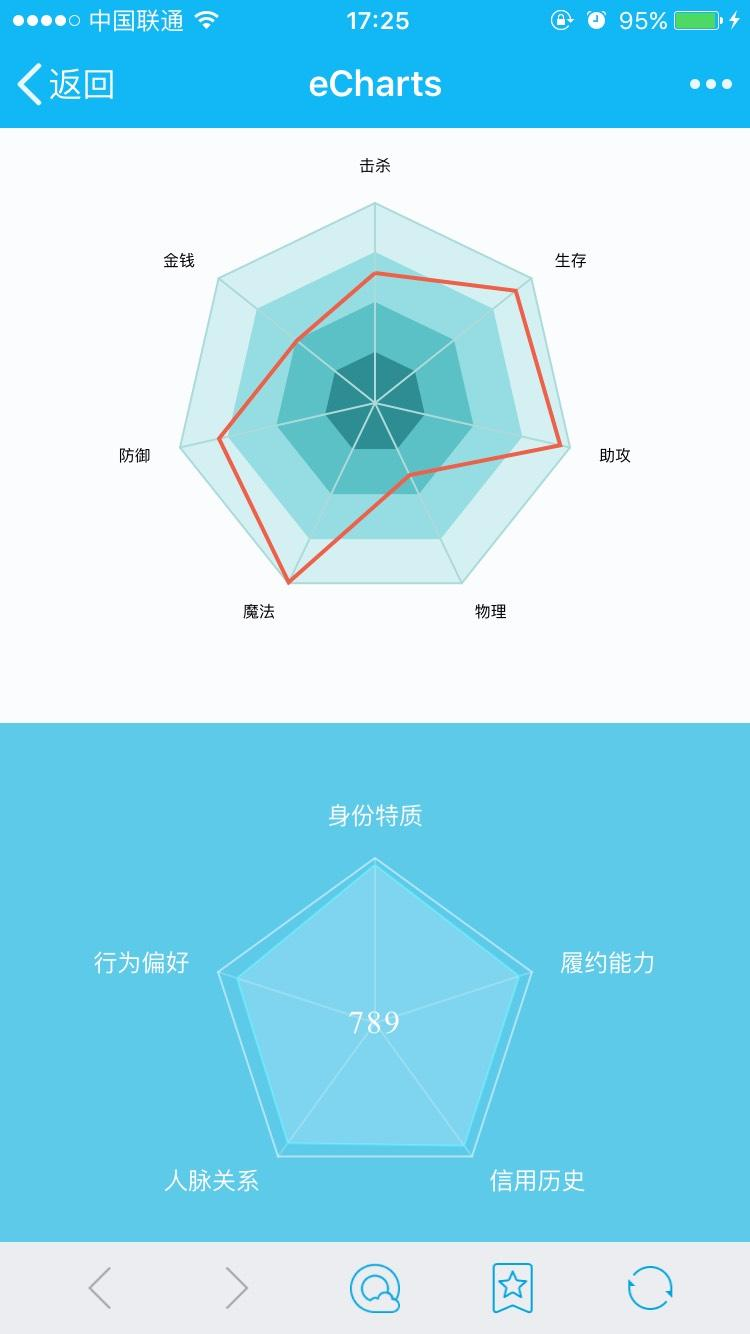
ECharts 英雄联盟能力分析雷达图及支付宝信用评分雷达图

ECharts 提供了常规的折线图、柱状图、散点图、饼图、K线图,用于统计的盒形图,用于地理数据可视化的地图、热力图、线图,用于关系数据可视化的关系图、treemap,多维数据可视化的平行坐标,还有用于 BI 的漏斗图、仪表盘,并且支持图与图之间的混搭。
- 在 body 中添加一个 div 标签,为该 div 设置一个 id 名,并设置宽和高。
- 引入 echarts.js 文件
//英雄联盟能力分析雷达图:
var myChartLol = echarts.init(document.getElementById("lol"));
var optionLol = {
    radar:[{
        indicator:[
            {text: "击杀", max: 200},
            {text: "金钱", max: 200},
            {text: "防御", max: 200},
            {text: "魔法", max: 200},
            {text: "物理", max: 200},
            {text: "助攻", max: 200},
            {text: "生存", max: 200}
        ],
        radius: 100,
        shape: "rect",
        splitNumber: 4,
        //文字颜色
        name:{
            textStyle:{color: "#000", fontFamily: '行楷', fontSize: 8}
        },
        splitLine: {
            lineStyle: {
                color: [
                    '#95dde2','#5cc1c7','#2d8d93','#abdada'
                ].reverse()
            }
        },
        axisLine: {
            lineStyle: {
                color: '#abdada'
            }
        },
        splitArea: {
            areaStyle: {
                color: [
                    '#2d8d93','#5cc1c7','#95dde2','#d5f0f2'
                ]
            }
        }
    }],
    series: [
        {
            type: 'radar',
            data: [
                {
                    value: [130,100,160,199,80,190,180],
                    symbolSize: 0,
                    lineStyle: {
                        normal: {
                            type: 'solid',
                            color: '#ee6049',
                            width: 2
                        }
                    }
                }
            ]
        }
    ]};

myChartLol.setOption(optionLol);
//支付宝信用评分雷达图:
var Price = echarts.init(document.getElementById("price"));
var optionPrice = {
    backgroundColor: 'rgba(27,181,226,.7)',
    radar: {
        splitNumber: 1,
        radius: "55%",
        //字体颜色
        name: {
            textStyle: {color: '#fff'}
        },
        //斜角分割线颜色
        axisLine: {
            lineStyle: {
                color: 'rgba(255,255,255,.2)'
            }
        },
        //雷达图中的背景色透明度
        splitArea: {
            areaStyle: {
                opacity: 0
            }
        },
        //最外层边框颜色
        splitLine: {
            lineStyle: {
                width: 1,
                color: 'rgba(255,255,255,.5)'
            }
        },
        indicator: [
            {text: '身份特质', max: 50},
            {text: '行为偏好', max: 50},
            {text: '人脉关系', max: 50},
            {text: '信用历史', max: 50},
            {text: '履约能力', max: 50}
        ]},

    series: [
        {
            type: 'radar',
            symbolSize: 0,
            //填充区域颜色
            areaStyle: {
                normal: {
                    color: 'rgba(255,255,255,.3)'
                }
            },
            data: [{
                value: [48,44,45,46,46],
                //数据边框样式
                lineStyle: {
                    normal: {
                        width: 1,
                        color: 'rgba(82,206,228,1)'
                    }
                }
            }]
        }
    ]
};
Price.setOption(optionPrice);
ECharts 已经为我们提供了很多的作品示例,平常使用的一些效果只需要引用某些示例,然后根据官方文档中的配置项来修改一些样式即可达到自己想要的效果。


