

第十三次作业——回归模型与房价预测
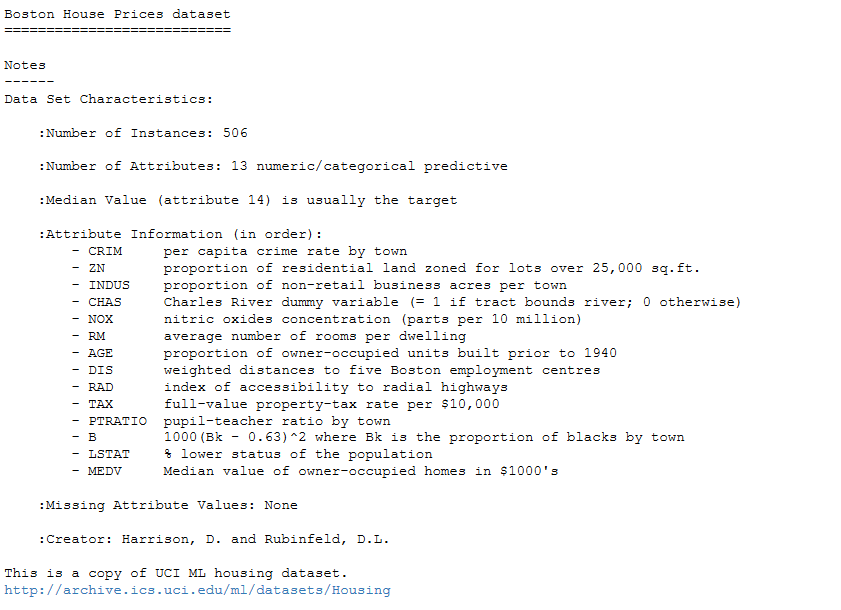
1. 导入boston房价数据集
from sklearn.datasets import load_boston
boston = load_boston()
boston.keys()

print(boston.DESCR)
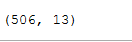
boston.data.shape #查看数据个数

import pandas as pd      #用pandas模型输出数据
pd.DataFrame(boston.data)
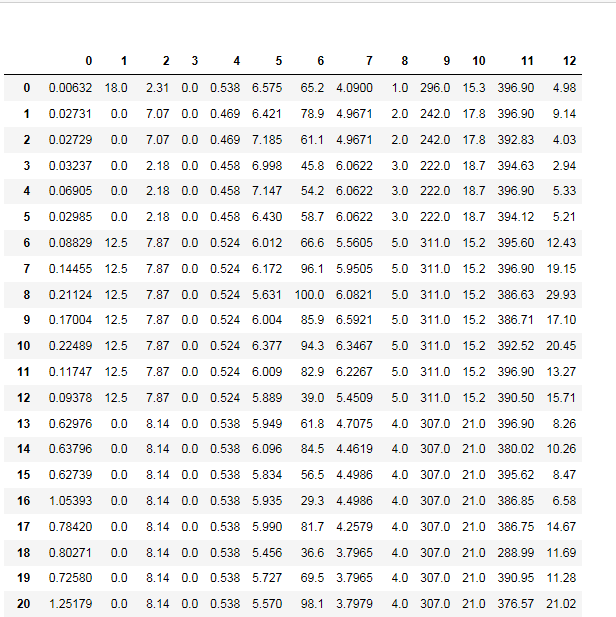
2. 一元线性回归模型,建立一个变量与房价之间的预测模型,并图形化显示。
import matplotlib.pyplot as plt
x = boston.data[:,5]       #第五个因素与房价的关系
y = boston.target
plt.figure(figsize=(10,6)) #图形大小
plt.scatter(x,y)           #散点图
plt.plot(x,9*x-20,'r')     #一元线性回归线,斜率
plt.show()
x.shape
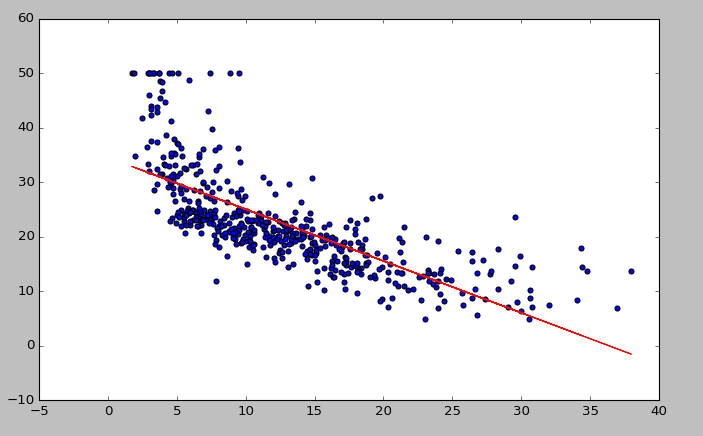
3. 多元线性回归模型,建立13个变量与房价之间的预测模型,并检测模型好坏,并图形化显示检查结果。
import matplotlib.pyplot as plt
x = boston.data[:,12].reshape(-1,1)
y = boston.target
plt.figure(figsize=(10,6))
plt.scatter(x,y)

from sklearn.linear_model import LinearRegression
lineR = LinearRegression()
lineR.fit(x,y)
y_pred = lineR.predict(x)
plt.plot(x,y_pred,'r')
print(lineR.coef_,lineR.intercept_)
plt.show()

#多元线性回归
from sklearn.linear_model import LinearRegression
lr = LinearRegression()
lr.fit(boston.data,y)
w = lr.coef_
print(w)

4. 一元多项式回归模型,建立一个变量与房价之间的预测模型,并图形化显示。
from sklearn.preprocessing import PolynomialFeatures
poly = PolynomialFeatures(degree=2)
poly.fit_transform(x)
lrp = LinearRegression()
lineR.fit(x,y)
y_pred = lineR.predict(x)
plt.plot(x,y_pred)

from sklearn.preprocessing import PolynomialFeatures
poly = PolynomialFeatures(degree=2)
x_poly = poly.fit_transform(x)

lrp = LinearRegression()
lrp.fit(x_poly,y)
y_pred = lineR.predict(x)
plt.plot(x,y_pred)

x_poly

from sklearn.preprocessing import PolynomialFeatures
poly = PolynomialFeatures(degree=2)
x_poly = poly.fit_transform(x)

lrp = LinearRegression()
lrp.fit(x_poly,y)
y_poly_pred = lrp.predict(x_poly)
plt.scatter(x,y)
plt.scatter(x,y_pred)
plt.scatter(x,y_poly_pred)
plt.show()

from sklearn.preprocessing import PolynomialFeatures
poly = PolynomialFeatures(degree=2)
x_poly = poly.fit_transform(x)

lp = LinearRegression()
lp.fit(x_poly,y)
y_poly_pred = lp.predict(x_poly)

plt.scatter(x,y)
plt.plot(x,y_pred,'r')
plt.scatter(x,y_poly_pred,c='b')
plt.show()

