Winform & Devexpress Chart使用入门
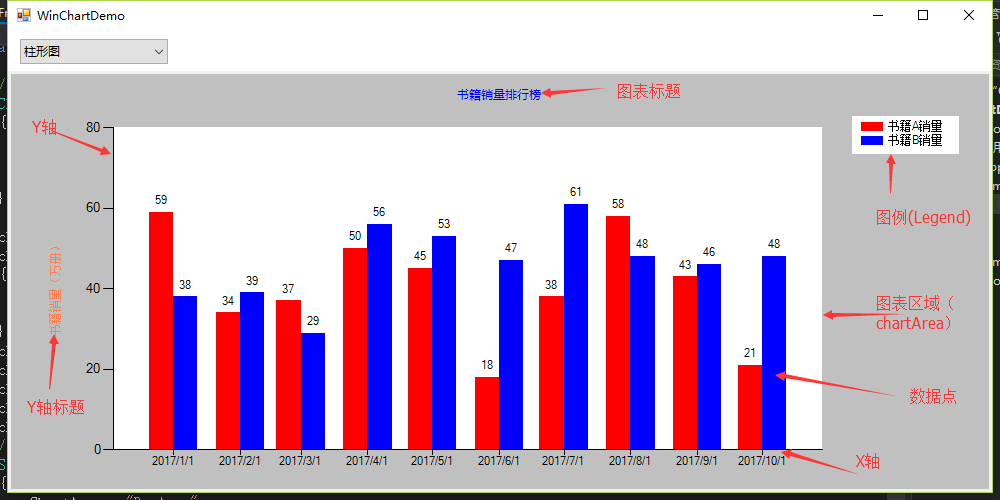
上点代码:
 1         /// <summary>
 2         /// 饼图
 3         /// </summary>
 4         private void ChartPie()
 5         {
 6             //ChartArea
 7             ChartArea chartArea = new ChartArea()
 8             {
 9                 Name = "PieArea",
10                 BorderWidth = 0,
11                 BorderDashStyle = ChartDashStyle.NotSet,
12             };
13             chartBar.ChartAreas.Clear();
14             chartBar.ChartAreas.Add(chartArea);
15             //Series
16             Series seriesBookA = new Series()
17             {
18                 ChartArea = "PieArea",
19                 Name = "书籍A销量",
20                 Color = Color.Red,
21                 Legend = "LegendBook",
22                 Tag = "BookASaleCount",
23                 ChartType = SeriesChartType.Pie,
24                 XAxisType = AxisType.Primary,
25                 XValueType = ChartValueType.DateTime,
26                 IsValueShownAsLabel = true,
27                 Label = "#VALY(#PERCENT{P0})",
28             };
29             chartBar.Series.Clear();
30             chartBar.Series.Add(seriesBookA);
31             //Point
32             double[] value = { 580 };
33             DataPoint dataPoint = new DataPoint()
34             {
35                 Name = "书籍A销售量",
36                 Color = Color.Red,
37                 YValues = value,
38                 LegendText = "书籍A销售量:" + value[0],
39             };
40             if (chartBar.Series.Count > 0)
41             {
42                 chartBar.Series[0].Points.Clear();
43                 chartBar.Series[0].Points.Add(dataPoint);
44                 value = new double[] { 700 };
45                 chartBar.Series[0].Points.Add(new DataPoint()
46                 {
47                     Name = "书籍B销售量",
48                     Color = Color.Blue,
49                     YValues = value,
50                     LegendText = "书籍B销售量:" + value[0],
51                 });
52                 value = new double[] { 300 };
53                 chartBar.Series[0].Points.Add(new DataPoint()
54                 {
55                     Name = "书籍C销售量",
56                     Color = Color.Pink,
57                     YValues = value,
58                     LegendText = "书籍C销售量:" + value[0],
59                 });
60             }
61             //Title
62             Title mainTitle = new Title()
63             {
64                 Name = "MainTitle",
65                 Text = "书籍销量",
66                 Font = new Font("微软雅黑", 12, FontStyle.Regular, GraphicsUnit.Pixel),
67                 ForeColor = Color.Blue,
68                 Docking = Docking.Top,
69                 IsDockedInsideChartArea = true,
70             };
71             chartBar.Titles.Clear();
72             chartBar.Titles.Add(mainTitle);
73             //Legend
74             Legend legend = new Legend()
75             {
76                 Name = "LegendBook",
77                 LegendStyle = LegendStyle.Table,
78                 Docking = Docking.Bottom,
79             };
80             chartBar.Legends.Clear();
81             chartBar.Legends.Add(legend);
82         }
二、ChartControl(Devexpress)
Dev的ChartControl用法和 Winform的类似,但是更为灵活

三、问题及解决方法
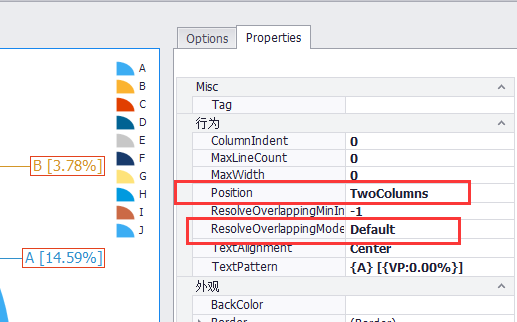
1.ChartControl(dev)饼图label重叠问题

以下属性设置可解决此问题

pieSeriesLabel1.Position = DevExpress.XtraCharts.PieSeriesLabelPosition.TwoColumns;
pieSeriesLabel1.ResolveOverlappingMode = DevExpress.XtraCharts.ResolveOverlappingMode.Default;


