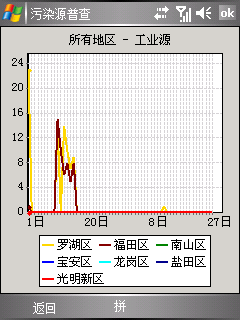
这两天花了点时间把这个图表整了下,可以支持多数据子项绘制了,描述信息也得到了修正和加强,已经可以正式在项目中用了。
当然,数据源的绑定有点限制,必须是DataTable,这个还不是很通用。数据列要有要求,Y轴DataColumn要求是数值类型,X轴DataColumn要求是DataTime,而且为了图片美观,目前是写死的(单位:天),但相信需要用的人是可以修改搞定的。
Dopod P800 实现效果如下:


调用方式示例:
Jrong.DBChart dbChart1 = new Jrong.DBChart();
this.dbChart1.Location = new System.Drawing.Point(12, 12);
this.dbChart1.Size = new System.Drawing.Size(240, 268);
this.dbChart1.Name = "dbChart1";
this.Controls.Add(this.dbChart1);
----------------------------------------------------------------
this.dbChart1.Items.Clear();
this.dbChart1.Items.Add(new Jrong.DBChart.DBChartItem("罗湖区", Color.Gold, 2, "xzqhfdm like '03%'"));
this.dbChart1.Items.Add(new Jrong.DBChart.DBChartItem("福田区", Color.Maroon, 2, "xzqhfdm like '04%'"));
this.dbChart1.Items.Add(new Jrong.DBChart.DBChartItem("南山区", Color.Green, 2, "xzqhfdm like '05%'"));
this.dbChart1.Items.Add(new Jrong.DBChart.DBChartItem("宝安区", Color.Blue, 2, "xzqhfdm like '06%'"));
this.dbChart1.Items.Add(new Jrong.DBChart.DBChartItem("龙岗区", Color.Aqua, 2, "xzqhfdm like '07%'"));
this.dbChart1.Items.Add(new Jrong.DBChart.DBChartItem("盐田区", Color.DarkBlue, 2, "xzqhfdm like '08%'"));
this.dbChart1.Items.Add(new Jrong.DBChart.DBChartItem("光明新区", Color.Red, 2, "xzqhfdm like '02%'"));
----------------------------------------------------------------
this.dbChart1.X_Column = "sj";
this.dbChart1.Y_Column = "gyycount";
----------------------------------------------------------------
DataTable table = new DataTable();
table.Columns.Add("xzqhfdm", typeof(string));
table.Columns.Add("sj", typeof(DateTime));
table.Columns.Add("gyycount", typeof(int));
/* 添加 table 行值 */
----------------------------------------------------------------
this.dbChart1.IsUseDBTime = false; // 自定义起始时间,因为从数据库查询到的结果可能缺少某些天的值
this.dbChart1.StartTime = this.dateTimePicker_Start.Value.Date;
this.dbChart1.EndTime = this.dateTimePicker_End.Value.Date;
----------------------------------------------------------------
this.dbChart1.DataSource = table; // 关键是这一句,会直接导致图片的刷新,当然,不会马上执行
OK,大功告成,在运行上述代码后DBChart就会在OnPaint事件里生成统计图片了,如果不想显示,可以直接通过 DBChart.Image 获取图片,本人在WebService上通过该控件获取图片成功。
最后,当然是最实际的,源码下载:DBChart.rar
当然,数据源的绑定有点限制,必须是DataTable,这个还不是很通用。数据列要有要求,Y轴DataColumn要求是数值类型,X轴DataColumn要求是DataTime,而且为了图片美观,目前是写死的(单位:天),但相信需要用的人是可以修改搞定的。
Dopod P800 实现效果如下:


调用方式示例:
Jrong.DBChart dbChart1 = new Jrong.DBChart();
this.dbChart1.Location = new System.Drawing.Point(12, 12);
this.dbChart1.Size = new System.Drawing.Size(240, 268);
this.dbChart1.Name = "dbChart1";
this.Controls.Add(this.dbChart1);
----------------------------------------------------------------
this.dbChart1.Items.Clear();
this.dbChart1.Items.Add(new Jrong.DBChart.DBChartItem("罗湖区", Color.Gold, 2, "xzqhfdm like '03%'"));
this.dbChart1.Items.Add(new Jrong.DBChart.DBChartItem("福田区", Color.Maroon, 2, "xzqhfdm like '04%'"));
this.dbChart1.Items.Add(new Jrong.DBChart.DBChartItem("南山区", Color.Green, 2, "xzqhfdm like '05%'"));
this.dbChart1.Items.Add(new Jrong.DBChart.DBChartItem("宝安区", Color.Blue, 2, "xzqhfdm like '06%'"));
this.dbChart1.Items.Add(new Jrong.DBChart.DBChartItem("龙岗区", Color.Aqua, 2, "xzqhfdm like '07%'"));
this.dbChart1.Items.Add(new Jrong.DBChart.DBChartItem("盐田区", Color.DarkBlue, 2, "xzqhfdm like '08%'"));
this.dbChart1.Items.Add(new Jrong.DBChart.DBChartItem("光明新区", Color.Red, 2, "xzqhfdm like '02%'"));
----------------------------------------------------------------
this.dbChart1.X_Column = "sj";
this.dbChart1.Y_Column = "gyycount";
----------------------------------------------------------------
DataTable table = new DataTable();
table.Columns.Add("xzqhfdm", typeof(string));
table.Columns.Add("sj", typeof(DateTime));
table.Columns.Add("gyycount", typeof(int));
/* 添加 table 行值 */
----------------------------------------------------------------
this.dbChart1.IsUseDBTime = false; // 自定义起始时间,因为从数据库查询到的结果可能缺少某些天的值
this.dbChart1.StartTime = this.dateTimePicker_Start.Value.Date;
this.dbChart1.EndTime = this.dateTimePicker_End.Value.Date;
----------------------------------------------------------------
this.dbChart1.DataSource = table; // 关键是这一句,会直接导致图片的刷新,当然,不会马上执行
OK,大功告成,在运行上述代码后DBChart就会在OnPaint事件里生成统计图片了,如果不想显示,可以直接通过 DBChart.Image 获取图片,本人在WebService上通过该控件获取图片成功。
最后,当然是最实际的,源码下载:DBChart.rar


