

Python用Flask 搭配前端WEB展示数据
前面用爬虫爬了近几年房价均值,和用Matplotlib 画了一个曲线图
然而直观的可视化信息一般都是在前端实现交互,下面我们用Python+Web实现一个小的数据展示
HTML代码
 1 <!DOCTYPE html>
 2 <html>
 3 <head>
 4     <meta charset="UTF-8">
 5     <title></title>
 6     <link rel="stylesheet" href="static/css/base.css"/>
 7 </head>
 8 <body onload="Onload()">
 9     <div class="head">重庆沙坪坝房价均值</div>
10     <div class="body_right">
11         <label>请输入年限(2009~2017)</label><input type="text" name="First_year"/><label>请输入比较年(2009~2017)</label><input type="text" name="Twice_year" /><input type="button" name="Submit" value="Submit"/>
12         <img id="showimg" />
13
14      </div>
15 </body>
16 </html>
17 <script type="text/javascript">
18     function Onload() {
19         var x = document.getElementsByName("Submit");
20         var First_year = document.getElementsByName("First_year")[0];
21         var Twice_year = document.getElementsByName("Twice_year")[0];
22         x[0].addEventListener("click", function () {
23             AJAX("get", "/find", "first=" + First_year.value + "&tiwce=" + Twice_year.value, 1)
24         });
25     }
26
27     function AJAX(type, url, datas, state) {
28         var xhr;
29         if (window.XMLHttpRequest) {//除Ie外的浏览器
30             xhr = new XMLHttpRequest;
31         } else if (window.ActiveXObject) {//Ie
32             try {
33                 xhr = new ActiveXObject("Msxml2.XMLHTTP");//IE4以下
34             } catch (e) {
35                 xhr = ActiveXObject("Micsoft.XMLHTTP");
36             }
37         }
38         if (type == "get" || type == "GET") {
39             url = url + "?" + datas;
40         }
41         xhr.open(type, url, true);
42         if (type == "post" || type == "POST") {
43             xhr.setRequestHeader("Content-Type", "Application/x-www-form-urlencoded");
44             xhr.send(datas);
45         } else if (type == "get" || type == "GET") {
46             xhr.send(null);
47         } else {
48             return false;
49         }
50         xhr.onreadystatechange = function () {
51             //switch (xhr.readyState) {
52             //         case 1:
53             //             alert("请求已经提出。。。");
54             //             break;
55             //         case 2:
56             //             alert("请求已发送。。。");
57             //             break;
58             //         case 3:
59             //             alert("请求处理中");
60             //             break;
61             //         case 4:
62             //             alert("请求成功");
63             //             alert(xhr.responseText);
64             //             break;
65             //     }
66             if (xhr.readyState == 4 && xhr.status == 200) {
67                 //alert(xhr.responseText);
68                 if (state == 1) {
69                     var jsons = JSON.parse(xhr.responseText);
70                     var show = document.getElementById("showimg");
71                     //alert(jsons.url)
72                     show.src = jsons.url;
73                 }
74             }
75         }
76     }
77 </script>
我们通过两个输入框将想要比较的年份信息通过AJAX异步传到后台Python,通过后台返回的图片路径,让img标签起到展示数据的作用
后台Python
 1 mport flask
 2 import pymongo
 3 import matplotlib.pyplot as mp
 4 import re
 5
 6 client = pymongo.MongoClient('mongodb://localhost:27017')
 7 app = flask.Flask(__name__)
 8
 9 @app.route('/')
10 def index():
11     return flask.render_template('base.html')
12 @app.route('/find')
13 def find():
14     first = flask.request.args.get('first')
15     twice = flask.request.args.get('tiwce')
16     firstTime = list(client['HousePrice']['CQ'].find({'dateTime':re.compile(first)}))
17     twiceTime = list(client['HousePrice']['CQ'].find({'dateTime': re.compile(twice)}))
18     MapOnex = []
19     MapOney = []
20     MapTwox = []
21     MapTwoy = []
22     for i in firstTime:
23         MapOnex.append(i['dateTime'][5:8])
24         MapOney.append(int(i['housePrice'][0:4]))
25     for i in twiceTime:
26         MapTwox.append(i['dateTime'][5:8])
27         MapTwoy.append(int(i['housePrice'][0:4]))
28     mp.title('CQSPBHousePrice')
29     mp.xlabel('Month')
30     mp.ylabel('Price')
31     mp.plot(MapOnex,MapOney, label = 'year:'+first)
32     mp.plot(MapTwox, MapTwoy, label='year:' + twice)
33     mp.legend(bbox_to_anchor=[0.5,1])
34     mp.grid()
35     mp.savefig('E:\Practice\CQHousePrice\static\IMG/'+first+'-'+ twice +'.png')
36     mp.close()
37     return flask.json.dumps({'url': '/static/IMG/'+first+'-'+twice +'.png'})
38 if __name__ == '__main__':
39     app.run('localhost', 5000)
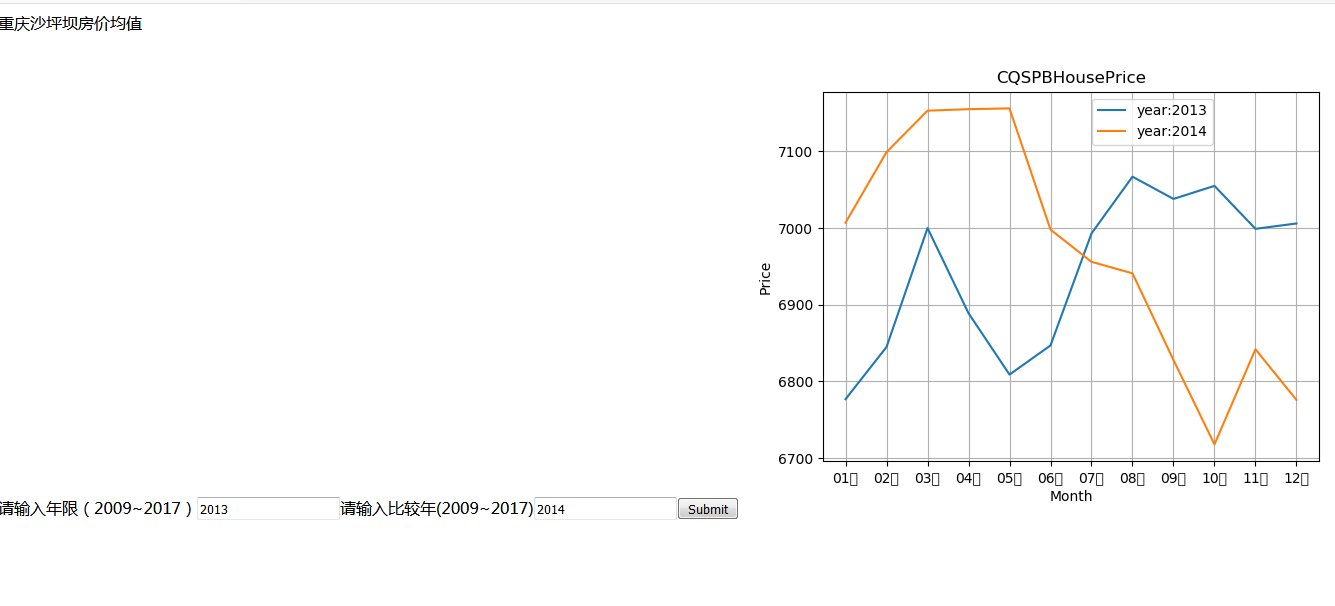
这里通过前端传来的两个年份信息,我们经行一个模糊查询,并将数据信息画成图,存入文件,通过JSON数组
将文件路径返回给前端JS,实现简单的Web与Python的交互,将数据可视化
效果图:
若您有改进建议或者问题,请在评论区指出
谢谢!
有志者 战天斗地!
无志者 怨天恨地!
