爬虫实战 —— 天气网合肥地区天气数据
抓取天气网中合肥地区11年到18年所有天气数据,并对输出的数据进行可视化。
目标网址:http://lishi.tianqi.com/hefei/index.html
一 抓取网站数据代码如下:
import requests
import re
from bs4 import BeautifulSoup
import time


def get_response(url):
     try:
          r = requests.get(url)
          r.raise_for_status()
          r.encoding = r.apparent_encoding
          return r.text
     except:
          print('')


#获取每年中每月的数据的链接,并将其保存在u_list里面
def get_year_href(r):
     u_list = []
     soup = BeautifulSoup(r,'lxml')
     res = soup.find('div','tqtongji1').contents
     a_soup = BeautifulSoup(str(res),'lxml')
     a = a_soup.find_all('a')
     for each in a:
          u_list.append(each.get('href'))
     return u_list


#根据获得每一月的链接,分别抓取每个链接对应的数据
def write_month_weather(url):
     r = requests.get(url).text
     soup = BeautifulSoup(r,'lxml')
     #保存每一天的数据的div,class = tqtongji2
     weather_res = soup.find('div',class_ = 'tqtongji2')
     #进一步解析weather_res
     ul_soup = BeautifulSoup(str(weather_res),'lxml')
     ul_list = ul_soup.find_all('ul')

     """
     2017年12月的url:http://lishi.tianqi.com/hefei/201712.html
     可以使用split()方法获得201712.html,
     再用正则表达式获取201712进行简单的文件命名:
     date = re.compile(r'[\d]*')
     mo = date.search(url.split('/')[-1])
     file_name = mo.group() + '.csv'

     """
     date = re.compile(r'[\d]*')
     mo = date.search(url.split('/')[-1])
     file_name = mo.group() + '.csv'

     #将每个月的数据保存到excel文件当中
     with open(file_name,'w+') as f:
          for ul in ul_list:
               li_soup = BeautifulSoup(str(ul),'lxml')
               li_list = li_soup.find_all('li')
               try:
                    for each in li_list:
"""
运行代码后在抓取到2016年08月的数据之后报错:
TypeError: unsupported operand type(s) for +: 'NoneType' and 'str'
这是因为从2016年08月开始,后面的部分数据可能出现为None类型的情况。
我的处理如下:
(1)将None改为'空'
     if each.string == None:
          each.string = '空'
     else:
          pass

(2)直接使用Python的异常处理忽略掉。

"""
                         #用逗号分隔
                         str_w = each.string + ','
                         f.write(str_w)
               except:
                    f.write('\n')
                    #continue要在for循环里面使用
                    continue
               f.write('\n')

def main():
     url = "http://lishi.tianqi.com/hefei/index.html"
     r = get_response(url)
     u_list = get_year_href(r)
     for i in range(len(u_list)):
          write_month_weather(u_list[i])
          print(u_list[i])
          time.sleep(1)
main()
二 对生成的数据进行可视化
使用柱状图和折线图分别表示(以201607的数据为例)
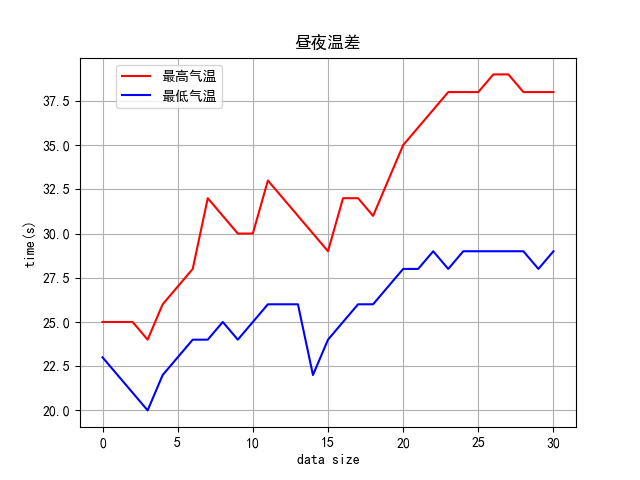
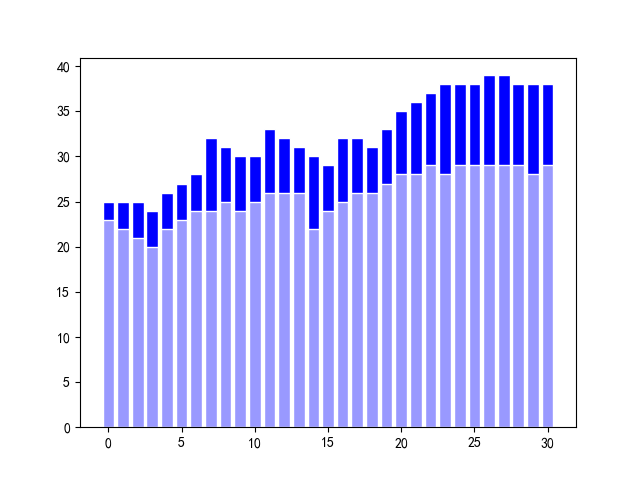
# -*- coding: GBK-*- #
#编码问题
import pandas as pd
import matplotlib.pyplot as plt
import numpy as np


"""
使用中文做label的时候,会出无法显示的问题,中文标签全部变成了小方格。
产生中文乱码的原因就是字体的默认设置中并没有中文字体,
所以我们只要手动添加中文字体的名称就可以了。

"""
from pylab import *
mpl.rcParams['font.sans-serif'] = ['SimHei']

##a = np.loadtxt(open("201607.csv","rb"),delimiter=",")
file = pd.read_csv('201607.csv',encoding="gbk")
#分别获取最高气温和最低气温
df1 = file.iloc[:,1:2]
df2 = file.iloc[:,2:3]

#获取折线图的横纵坐标
x = df1.index
y1 = df1[u"最高气温"]
y2 = df2[u"最低气温"]


"""
也可以使用柱状图表示温差,代码如下:
plt.bar(x,y1,width=0.8,facecolor="blue",edgecolor="white")
plt.bar(x,y2,width=0.8,facecolor="#9999ff",edgecolor="white")
plt.show()

"""
plt.title('昼夜温差')
plt.xlabel('data size')
plt.ylabel('time(s)')

plt.plot(x, y1,'r', label='最高气温')
plt.plot(x, y2,'b',label='最低气温')

plt.legend(bbox_to_anchor=[0.3, 1])
plt.grid()
plt.show()
运行结果如下图:
(1)柱状图
(2)折线图